
Learn to create a linear function to model situations and connect representations of the linear function with ease.
What We Review
Why Linear Functions Dominate SAT® Math
Linear models appear in almost every SAT® Math section. College Board trend reports show that roughly 35 to 40 percent of non-calculator and calculator items involve a linear relationship, a straight-line graph, or a constant rate. Therefore, mastering the concept of a linear function is a high-impact way to raise a score.
Beyond the test, lines explain real-world issues: budgeting weekly expenses, predicting cell-phone data charges, or converting currencies. Because the SAT® stresses relevance, questions frequently ask students to connect representations of linear functions or to create linear functions to model situations.
Connecting Linear Functions to Linear Equations
When SAT® Math questions ask about linear functions, they’re often really asking about linear equations, just framed in a real-world or multi-representation context. A linear function is simply a rule that assigns each input x exactly one output f(x) with a constant rate of change.
This rule is commonly expressed as a linear equation in the form y = mx + b, where m is the slope (rate of change) and b is the y-intercept (starting value). However, SAT® questions may also present the same rule using function notation, written as f(x) = mx + b.
Function notation is just another way of showing that the output depends on the input. Instead of using y, the function is named f, and f(x) means “the value of the function when x is input.” It’s a formal way of describing the same relationship.
For example, y = 2x + 5 and f(x) = 2x + 5 represent the same linear function.
Understanding both notations and how to move between them is essential for solving SAT® questions with confidence.
The Four Key Representations of a Linear Function
Learning a linear function is like hearing the same song sung in four languages. The melody remains, but the words change.
Verbal (Word Descriptions)
A statement such as “A gym charges a \$25 sign-up fee plus \$10 per visit.”
Tabular (Input/Output Table)
| Visits (x) | Cost (f(x)) |
| 0 | 25 |
| 1 | 35 |
| 2 | 45 |
Algebraic (Equation)
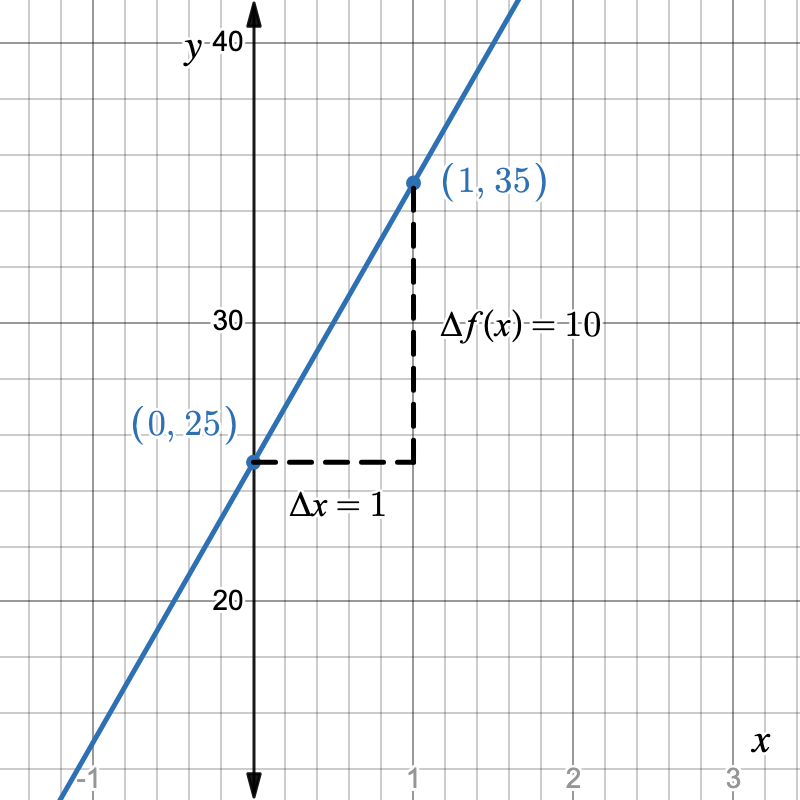
f(x) = 10x + 25Graphical (Coordinate Plane)
A straight line with slope 10 and y-intercept of 25.
Creating Linear Functions from Given Information
Forming a function begins with identifying the slope (rate of change) and intercept (starting value).
Using Two Input/Output Pairs
Example
The line passes through the points (2, 7) and (6, 19). Write its function in slope intercept form.
Step 1: Find the slope
Use the slope formula with the two points:
Step 2: Use point-slope form
Substitute m = 3 and the point (2, 7) into the point-slope formula:
Step 3: Convert to slope-intercept form
Distribute and simplify:
y = 3x -+1
Step 4: Write in function notation
The function is f(x) = 3x + 1.
Using One Pair plus the Rate of Change
Example
A taxi charges \$1.75 per mile and \$3 to start. Create a function for total cost C(m) after m miles.
The slope is 1.75 and the y-intercept is 3. Therefore, C(m) = 1.75m + 3.
From a Verbal Description
Example
A tank contains 500 liters of water and drains at 12 liters per minute.
Let t represent the number of minutes and W(t) represent the liters of water left. The slope is –12 (because the amount decreases). The y-intercept is 500. Hence, W(t) = -12t + 500.
Moving Between Representations (Connecting the Dots)
Table → Equation
| x | f(x) |
| -2 | 1 |
| 1 | 10 |
Slope:
m = \dfrac{10 - 1}{1 - (-2)} = \dfrac{9}{3} = 3Use (1, 10):
f(x) - 10 = 3(x - 1) ⇒ f(x) = 3x + 7Equation → Graph
Changing the slope m tilts the line; increasing b shifts the line up.
What happens when the slope doubles?
If f(x) = 2x + 4 changes to f(x) = 4x + 4, every x-step produces twice the vertical rise, so the graph grows steeper.
Graph → Table or Verbal
Reading two clear points from a graph returns a table. The same data can be turned into a story: “Each extra ticket sold adds \$12 to revenue, starting from \$60.”
Example
A line is graphed with intercept (0, 6) and passes through (3, 0). Write the function that represents this.
Step 1: Calculate the slope
m = \dfrac{0 - 6}{3 - 0} = -2Step 2: Calculate the y-intercept
Using the point (0, 6), we can determine that the y-intercept is 6.
Step 3: Write the function
f(x) = -2x + 6Interpreting Linear Functions in Context
Meaning of Slope, Intercept, and Terms
In P(h) = 15h + 90, the slope 15 is “\$15 per hour” and the intercept 90 is “sign-on bonus of \$90.”
Finding an Output Given an Input
Example
Using P(h) = 15h + 90, find the pay after 6 hours.
P(6) = 15(6) + 90 = 180.Therefore, the pay is \$180.
Finding an Input Given an Output
If the target pay is \$285, solve for h.
| Step | Reason |
|---|---|
| P(h) = 15h + 90 | Original equation |
| 285=15h + 90 | Substitute \$285 for P(h) |
| 195=15h | Subtract 90 from both sides |
| 13=h | Divide both sides by 15 |
So, h = 13 hours.
Common SAT® Traps
- Phrases like “no more than” often signal inequality.
- “At this rate” refers to slope.
- Watch for hidden negatives when quantities fall.
Example
A ride-share app charges \$0.40 per minute plus a \$2 booking fee. How many minutes make the cost \$10?
Step 1: Write the function
Let m represent the number of minutes and C(m) represent the cost. Then the function is C(m)=0.40m+2.
Step 2: Solve for the number of minutes
| Step | Reason |
|---|---|
| C(m) = 0.4m + 2 | Original function |
| 10 = 0.4m + 2 | Substitute C(m) = 10 |
| 8 = 0.4m | Subtract 2 from both sides |
| m = 20 | Divide both sides by 0.4 |
So, t = 20 minutes.
Quick Tips & Pitfalls on the SAT®
- Always match units (dollars with dollars, minutes with minutes).
- If both points have larger x-values paired with smaller y-values, the slope is negative.
- When time is short, estimate slope by using grid intersections.
- Check intercepts: some graphs show the x-axis other than at zero.
Quick Reference Vocabulary Chart
| Term | Student-Friendly Definition |
| Linear function | A rule whose graph is a straight line, written in function notation |
| Slope (m) | Rate of change; how much y changes for each 1-unit change in x. |
| y-intercept (b) | Point where the line crosses the y-axis (x = 0). |
| x-intercept | Point where the line crosses the x-axis (y = 0). |
| Rate of change | Another name for slope, often linked to units. |
| Input | The x-value fed into a function. |
| Output | The resulting y-value. |
| Domain | All possible inputs. |
| Range | All possible outputs. |
| Constant term | The standalone number (like b). |
| Factor | A quantity multiplied by another (e.g., m in mx). |
| Standard form | Ax + By = C |
| Slope-intercept form | y = mx + b |
Mini Practice Set
1. Which equation represents a line with slope 5 and y-intercept –3?
A. y = 5x - 3
B. y = -5x - 3
C. y = 5x + 3
D. y = -5x + 3
2. A factory has already produced 150 gadgets and makes 40 more each day. After how many days will it reach 470 gadgets?
Solutions
1. A
2. 8 days
Conclusion & Next Steps
Linear functions are the backbone of SAT® Math, but they follow consistent rules. Remember to:
- Identify slope and intercept quickly.
- Translate smoothly between verbal, tabular, algebraic, and graphical forms.
- Practice creating and connecting representations daily.
Strong line skills translate into stronger SAT® scores and a clearer understanding of everyday math.
Sharpen Your Skills for SAT® Math (Digital)
Are you preparing for the SAT® Math (Digital) test? We’ve got you covered! Try our review articles designed to help you confidently tackle real-world SAT® Math (Digital) problems. You’ll find everything you need to succeed, from quick tips to detailed strategies. Start exploring now!
Need help preparing for your SAT® Math (Digital) exam?
Albert has hundreds of SAT® Math (Digital) practice questions, free response, and full-length practice tests to try out.


