
What We Review
Overview
Imagine you’re signing up for an online tutoring service to help with school. Plan A charges a flat membership fee of \$20 per month, plus \$5 for each live tutoring session. Alternatively, Plan B charges just \$5 per month, but each tutoring session costs \$8. You want to spend no more than \$100 in total and attend at least 10 tutoring sessions this month. Which plan meets your needs? Questions like this rely on systems of linear inequalities. By the end of this guide, students will confidently interpret a system of linear inequalities on the SAT® and choose winning options in real life.
Why SAT® Test-Makers Love Linear Inequalities
The SAT® frequently measures:
- modeling a real-world situation
- translating words into math
- reading graphs under time pressure
Therefore, expect the following formats:
- Multiple-choice: Pick the point that satisfies all inequalities.
- Student-produced response: Write an inequality from a context.
- Grid-in: Find the least or greatest integer in the solution set.
Linear Inequality in Two Variables
Forms to know
- Slope-intercept: y = mx + b becomes y </≤/≥/> mx + b
- Standard: Ax + By = C becomes Ax + By </≤/≥/> C
Shading & boundary lines
- Solid lines are “inclusive.” These points are included in the solution. They use the symbols ≤ and ≥.
- Dotted lines are “exclusive.” These points are excluded from the solution. They use the symbols < and >.
- Always shade the half-plane that satisfies a test point; the easiest point is usually (0, 0).
Example: Budgeting Concert Tickets
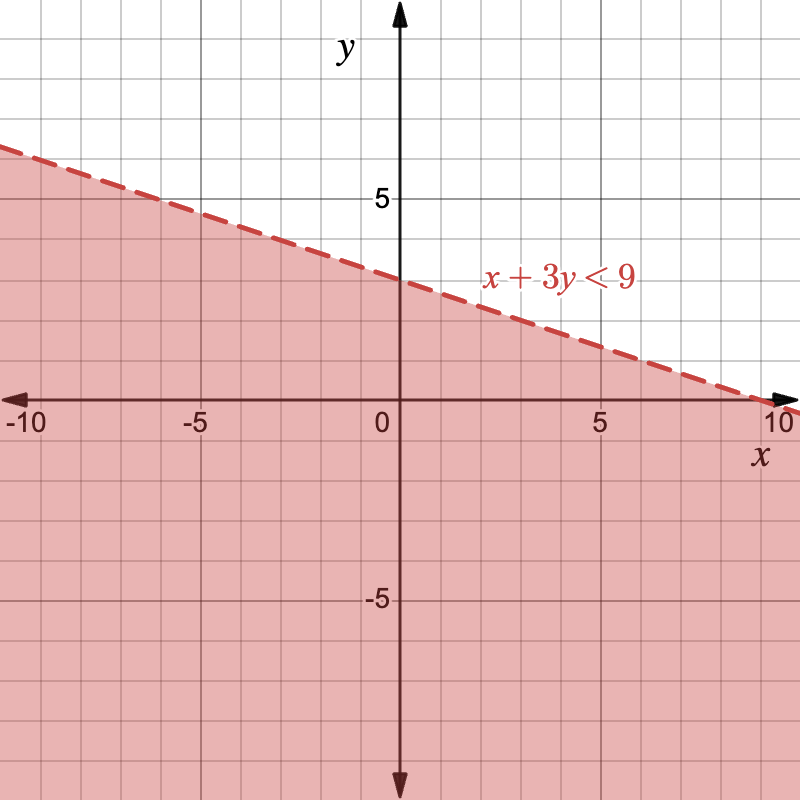
Tickets to a concert cost \$12 each. A group’s budget is \$96 max.
Let x = the number of tickets, y = dollars spent.
Step 1: Write inequality y = 12x becomes y \le 12x because spending cannot exceed the product.
Step 2: Graph the inequality.
- Since the inequality symbol is ≤, plot a solid line
- Shade below line (test (0,0): 0 ≤ 0 ✔).
Quick graphing checklist
- Rearrange to y = mx + b if needed.
- Draw a line (decide dashed or solid).
- Pick a test point.
- Shade the correct side.
Core Skill: Interpret a System of Linear Inequalities
Definition
A system is two or more inequalities. The feasible region is the overlap of all shaded areas; points there satisfy every inequality.
Visualizing overlap
Think of two spotlights on a stage; only the intersection is lit by both. Likewise, only overlapping regions solve the system.
Example: Choosing a Club Budget
You’re planning a fundraiser with your school club to raise money for a volunteer trip. You want to design custom t-shirts and stickers to sell at a school event.
- Each t-shirt costs \$6 to produce.
- Each sticker costs \$1 to produce.
- Your club has a total production budget of \$300.
- You also don’t want to make more than 100 total items to keep it manageable.
Let x be the number of t-shirts and y be the number of stickers.
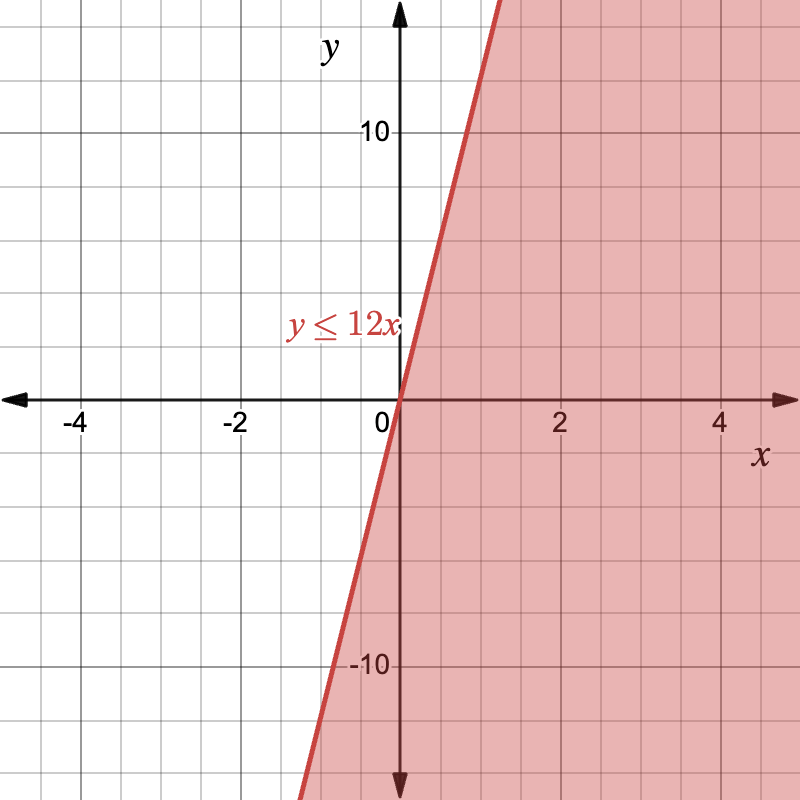
First, set up a system of inequalities.
- Budget: 6x+y≤300
- Total items: x+y≤100
Next, rewrite the inequalities into slope-intercept form to make graphing easier.
- 6x+y≤300 → y≤-6x+300
- x+y≤100 → y≤-x+100
Finally, graph the system of linear inequalities. All points that lie in the overlap of the shading are solutions to the system of linear inequalities, as long as those points are positive (since the number of t-shirts and the number of stickers cannot be negative).
Test-day pointers
- Always rewrite word conditions back into inequalities first.
- Look for “intersection,” “overlap,” or “both conditions.”
- Test a representative point to avoid trap shading.
Moving Between Representations
A strong SAT® scorer flips quickly among tables, graphs, and algebra.
- Table → graph: plot each ordered pair, draw a line.
- Graph → inequality: check slope and y-intercept, then decide symbol by shading.
- Table → inequality: spot pattern, use slope formula.
Word Problems & Context Clues
Key phrases
- “No more than” → \le
- “At least” → \ge
- “Fewer than” → <
However, always confirm inclusivity based on context.
Example: Catering Company
You’re planning a party and deciding how many of two types of food platters to order. Platter A feeds 4 people and costs \$30, while Platter B feeds 8 people and costs \$50. You have a total budget of \$300 and need to make sure you can feed at least 35 people.
Let a = Platter A, b = Platter B.
Inequalities:
- Budget: 30a + 50b \le 300
- Guests: 4a + 8b \ge 35
- There are constraints on these inequalities since the number of platters cannot be negative: a \ge 0, ; b \ge 0
Now, we can graph the inequalities.
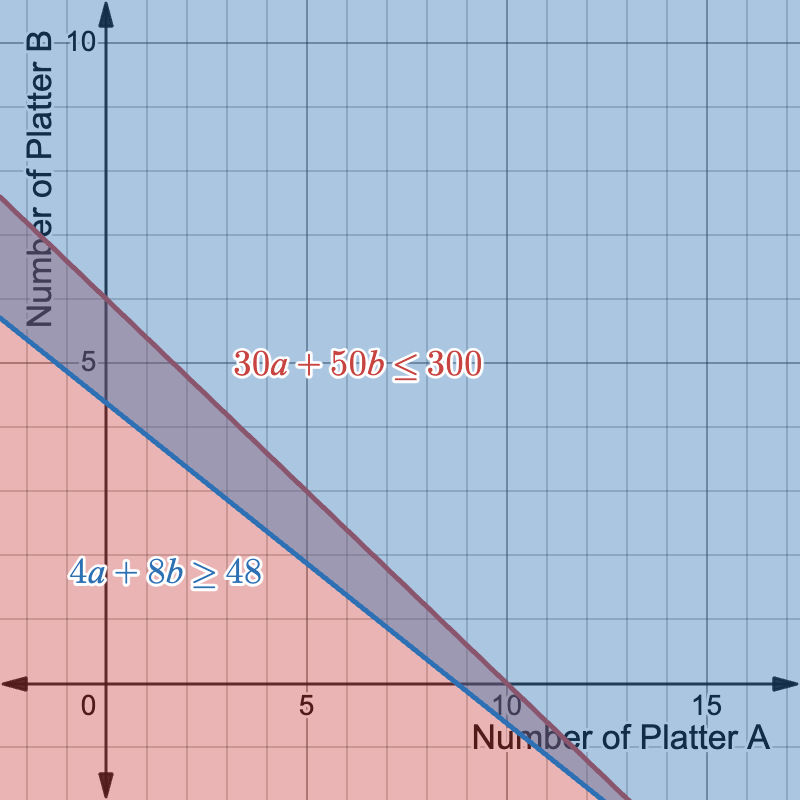
Each point meeting both inequalities represents a catering plan that feeds everyone within budget. Remember to account for the constraints on the problem. We cannot use any negative values for the number of platters. For example, one option is to have 4 platters of Platter A and 3 platters of Platter B.
Typical SAT® Traps & How to Dodge Them
- Reversing the sign when multiplying or dividing by a negative. Always flip the inequality!
- Inclusive vs. exclusive language. “At least” includes the boundary.
- Skipping the test point. Therefore, always check (0, 0) or another simple point when graphing.
Quick-Reference Vocabulary Chart
| Term | Definition | SAT® Hint |
| Inequality symbol | One of <, \le, >, \ge | Match words like “at most” or “no less than.” |
| Boundary line | An overlapping shaded area that solves a system | Dashed if not inclusive, solid if inclusive. |
| Feasible region | A simple coordinate used to decide shading | Any point here satisfies all inequalities. |
| Test point | Simple coordinate used to decide shading | (0, 0) works unless its on the boundary. |
| Intersection | Common points of two or more sets | Where solution regions overlap. |
Mini Practice Set
- The inequality 5x - 2y \le 10 is graphed. Is the point (4, 5) in the solution set?
- A gym membership costs \$25 monthly plus \$3 per class. The total cost should be under \$70. Write an inequality in two variables for months (m) and classes (c).
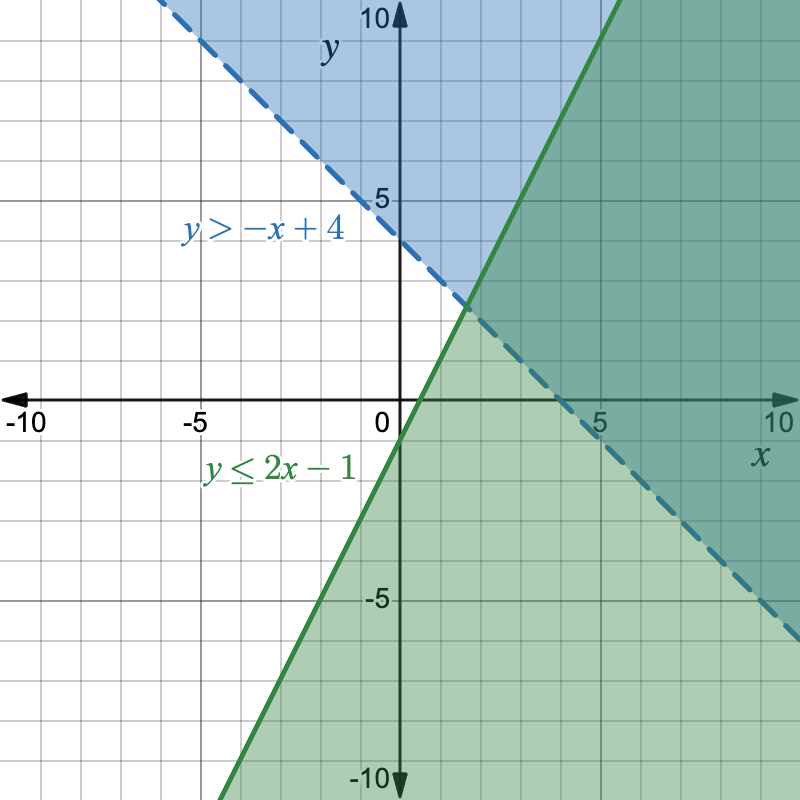
- Solve the system:
- \begin{cases} y > -x + 4 \\ y \le 2x - 1 \end{cases}
- Is the point (2, 1) feasible?
Answers
- Yes
- 25m + 3c < 70
- (2, 1) is not feasible
Closing Thoughts & Next Steps
Interpreting a system of linear inequalities is a high-yield SAT® skill. With practice, students will quickly translate words to math, draw accurate graphs, and spot feasible solutions.
Sharpen Your Skills for SAT® Math (Digital)
Are you preparing for the SAT® Math (Digital) test? We’ve got you covered! Try our review articles designed to help you confidently tackle real-world SAT® Math (Digital) problems. You’ll find everything you need to succeed, from quick tips to detailed strategies. Start exploring now!
Need help preparing for your SAT® Math (Digital) exam?
Albert has hundreds of SAT® Math (Digital) practice questions, free response, and full-length practice tests to try out.


