

Probability and conditional probability often appear in the Algebra and Problem Solving & Data Analysis domains. Therefore, earning even a few extra points on these questions can boost a total math score.
What We Review
Why Probability Matters on the SAT®
Imagine choosing a door on a game show, guessing the next song on shuffle, or deciding whether to bring an umbrella. All involve probability. On the SAT®, about 10–15\% of math questions ask students to compute or interpret chance. However, many test-takers skip these items because the wording looks “stat-heavy.” Mastering a short list of formulas quickly fixes that problem.
Key SAT® sub-scores that include probability questions:
- Heart of Algebra
- Problem Solving & Data Analysis
Next, the basics will be broken into small, clear steps.
Probability Basics: The Building Blocks
What Is Probability?
Probability is the chance that an event will happen. It is always a number between 0 (impossible) and 1 (certain).
Core formula:
P(\text{Event})=\dfrac{\text{favorable outcomes}}{\text{total outcomes}}
Because the numerator is part of the denominator, the probability can also be written as a decimal or percent.
Example 1: Rolling a Die
Question: A fair six-sided die is rolled once. What is the probability of rolling an even number?
Solution:
- Identify favorable outcomes.
- Even faces: 2, 4, 6 (3 outcomes).
- Identify total outcomes.
- Total faces: 1 through 6 (6 outcomes).
- Apply the formula.
- P(\text{even})=\dfrac{3}{6}=\dfrac{1}{2}=0.5=50\%
Therefore, the chance is 50\%.
Key Terms to Know
- Event: One or more outcomes of interest.
- Sample space: All possible outcomes.
- Mutually exclusive: Two events that cannot happen at the same time (e.g., rolling a 2 or a 3 on a single roll).
These definitions support the ability to compute probability quickly.
Conditional Probability: Adding “Given” Information
Concept Overview
A conditional probability answers, “What is the chance of A happening, given that B has already occurred?”
The notation uses a vertical bar “|”:
P(A \mid B).
Formula:
P(A\mid B)=\dfrac{P(A\cap B)}{P(B)}
The numerator is the probability that both A and B occur; the denominator limits attention only to cases where B occurs.
Example 2: Drawing Cards
A standard deck has 52 cards, 4 of which are aces.
Question A (without replacement):
One card is removed and kept aside. A second card is drawn. What is the probability that the second card is an ace given that the first card was an ace?
Solution:
- Removing an ace first changes the deck size.
- Remaining cards: 51
- Remaining aces: 3
- Conditional probability:
- P(\text{2nd Ace}\mid \text{1st Ace})=\dfrac{3}{51}=\dfrac{1}{17}\approx0.0588
Question B (with replacement):
What if the first card is returned and the deck is reshuffled?
Then, the deck is unchanged: 52 cards, 4 aces. Therefore:
P(\text{2nd Ace}\mid \text{1st Ace with Replacement})=\dfrac{4}{52}=\dfrac{1}{13}\approx0.0769Because replacement makes the events independent, the denominator stays the same.
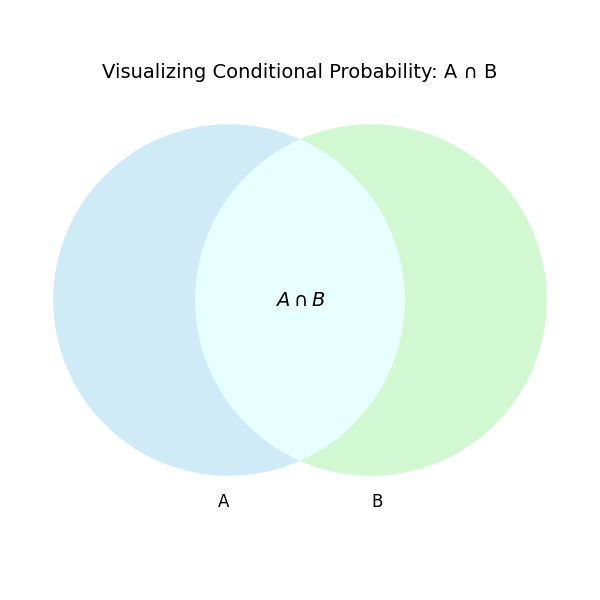
Visual Aid: Overlapping Events
A quick sketch of two overlapping circles (A and B) reminds students that A\cap B represents the overlap. The conditional formula simply “zooms in” on circle B and asks how much of that zoomed view is also in A.
Common Misunderstandings
- Independent events: Knowing B happened does not change the probability of A.
- Dependent events: Knowing B happened does change the chance of A.
- A common SAT® trap is confusing “at least one” with exactly one.
Using Two-Way Tables and Probability Models
Setting Up a Frequency (Contingency) Table
Many SAT® questions provide a partial table and ask test-takers to fill in missing cells or find probabilities. Always total the rows and columns first; the margins equal the sum of each row or column.
Example 3: Sports vs. Handedness
A survey of 90 students recorded whether each plays a school sport and whether each is left-handed. Results:
| Plays Sport | Does Not Play | Total | |
| Left-Handed | 9 | ? | 15 |
| Right-Handed | ? | 48 | 75 |
| Total | 36 | 54 | 90 |
Solution:
1. Fill in the missing cells.
- Left-Handed + Plays Sport = 9; total left-handed = 15⇒ Left-Handed + Does Not Play = 15 – 9 = 6.
- Plays Sport total = 36; 9 already counted as left-handed⇒ Right-Handed + Plays Sport = 36 – 9 = 27.
Completed table:
| Plays Sport | Does Not Play | Total | |
| Left-Handed | 9 | 6 | 15 |
| Right-Handed | 27 | 48 | 75 |
| Total | 36 | 54 | 90 |
2. Compute the joint probability: a student is left-handed and plays a sport.
P(L\cap S)=\dfrac{9}{90}=\dfrac{1}{10}
3. Compute the conditional probability: a student plays a sport given that the student is left-handed.
P(S\mid L)=\dfrac{9}{15}=\dfrac{3}{5}=0.6=60%
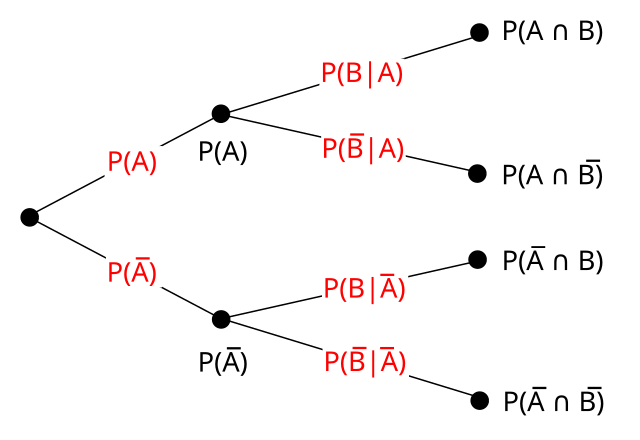
Tree Diagrams for Sequential Events
When events happen in order, a tree diagram keeps branches organized. Each branch’s probability multiplies down the path. On the SAT®, a quick sketch with short numbers prevents denominator mistakes.
From Formulas to Interpretation: What Do the Numbers Tell Us?
Translating Fractions, Decimals, and Percents
Because SAT® multiple-choice answers vary in format, convert fractions to decimals when necessary. Multiply by 100 to switch a decimal to a percent.
Deduce Unknowns
Sometimes the SAT® gives a probability and asks for an unknown frequency.
Example wording: “If 20\% of 120 students prefer tea, how many students prefer tea?”
Compute: 0.20 × 120 = 24
Example 4: Medical Test Accuracy (Simplified)
A disease affects 2\% of a population. A test is 95\% accurate for sick patients (true positive) and 90\% accurate for healthy patients (true negative).
Question: If a random person tests positive, what is the probability that the person actually has the disease?
Solution:
1. Create a tree diagram. Start with 1000 people for easy numbers.
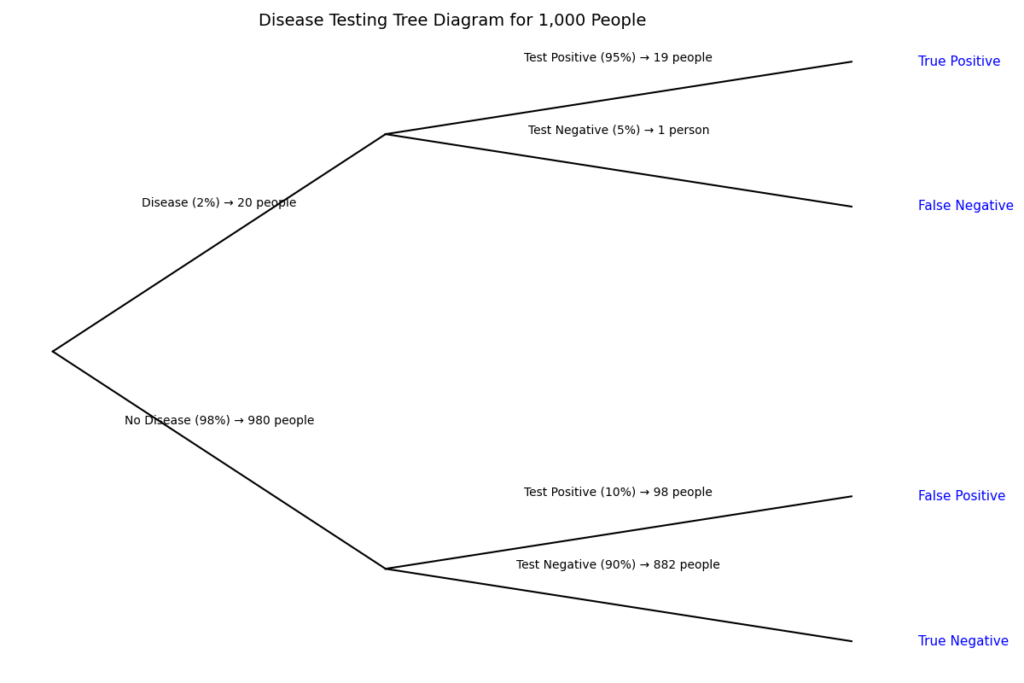
- Diseased: 2\% → 20 people.
- Test positive: 95\% of 20 → 19.
- Test negative: 1.
- Healthy: 98\% → 980 people.
- Test positive (false positive): 10\% of 980 → 98.
- Test negative: 882.
2. Total positive tests = 19 + 98 = 117.
3. Conditional probability:
P(\text{disease}\mid \text{positive})=\dfrac{19}{117}\approx0.162\approx16.2%
Therefore, even with a “good” test, most positives are false due to the low base rate.
Pitfalls, Shortcuts, and SAT® Test-Day Tips
- Watch wording. “At least,” “exactly,” and “not” change the entire denominator.
- Use complements. Computing P(\text{not A})=1-P(A) often saves time.
- Double-check denominators in conditional questions; the sample space shrinks.
- Choose the right tool. For simple fractions like \frac{1}{4}, mental math is faster; for messy decimals, the calculator helps.
Quick Reference Chart
| Term | Concise Definition | SAT® Note |
| Probability | P(\text{Event})=\dfrac{\text{favorable}}{\text{total}} | Always between 0 and 1 |
| Event | Outcome or set of outcomes | Often labeled A, B |
| Sample space | All possible outcomes | The denominator of any basic probability |
| Independent events | One event does not affect the other | The multiplication rule applies |
| Dependent events | One event changes the chance of the other | Use the conditional formula |
| Mutually exclusive | Cannot occur together | P(A\cap B)=0 |
| Intersection | Both events occur A\cap B | Shaded overlap in Venn |
| Union | At least one event occurs A\cup B | Add, then subtract the overlap |
| Conditional probability | Probability of A given B P(A\mid B) | Denominator reduces to B |
| Complement | “Not A”: A^{c} | P(A)+P(A^{c})=1 |
| Relative frequency | Ratio from data, not theory | Found in two-way tables |
| Two-way table | Grid of frequencies | Helps visualize data questions |
Practice Mini-Set
Question 1
A jar contains 4 red, 5 blue, and 1 green marble. One marble is selected at random. Compute the probability that the marble is blue.
A) 0.2 B) 0.5 C) 0.4 D) 0.45
Question 2
The same jar is used, but now two marbles are chosen without replacement. What is the probability that the second marble is green given that the first marble was blue?
A) \dfrac{1}{9} B) \dfrac{1}{10} C) \dfrac{1}{5} D) \dfrac{1}{6}
Question 3
A group of 120 students is classified by grade level and club membership. A two-way table shows that 35 students are seniors, 40 students are in the drama club, and 15 students are seniors and in the drama club. If a student is chosen at random, what is the probability that the student is in the drama club, given that the student is not a senior?
A) \dfrac{25}{85} B) \dfrac{40}{120} C) \dfrac{25}{120} D) \dfrac{15}{35}
Answer Key
- Choice B
- Choice A
- Choice A
Wrap-Up and Next Steps
Probability skills revolve around three ideas: counting outcomes, picking the right denominator, and reading question wording carefully. Therefore, regular timed practice strengthens confidence. Next, explore additional SAT® Math practice sets to reinforce probability and conditional probability skills and to boost problem-solving speed. Good luck on the test day!
Sharpen Your Skills for SAT® Math (Digital)
Are you preparing for the SAT® Math (Digital) test? We’ve got you covered! Try our review articles designed to help you confidently tackle real-world SAT® Math (Digital) problems. You’ll find everything you need to succeed, from quick tips to detailed strategies. Start exploring now!
Need help preparing for your SAT® Math (Digital) exam?
Albert has hundreds of SAT® Math (Digital) practice questions, free response, and full-length practice tests to try out.


