
Ever seen a headline that shouts, “80\% of teens can’t live without their phones”? It sounds convincing, yet should it be trusted? SAT® Math loves to test this skill. Therefore, learning how to evaluate statistical claims and understand their statistical significance builds confidence on test day and in real life. This guide breaks the ideas into bite-sized pieces, sprinkled with step-by-step examples, practice, and must-know tips.
What We Review
Why Evaluate Statistical Claims?
- SAT® Math dedicates several questions to data analysis and problem-solving.
- Colleges, companies, and voters use data to make choices; incorrect conclusions can be costly.
Hence, mastering this topic converts tricky graphs and tables into quick points.
From Sample to Population: The Basics of Random Sampling
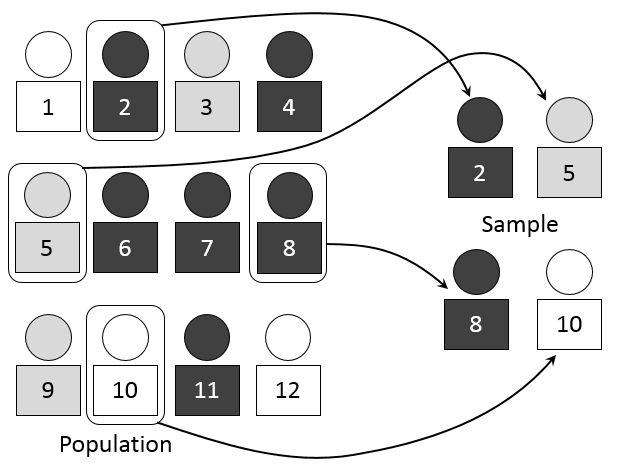
What Is a Random Sample?
A random sample is a subset of individuals chosen so that every member of the population has an equal chance of selection. In contrast:
- Convenience sample: whoever is easy to reach.
- Voluntary response sample: participants step forward on their own.
Why Random Sampling Matters for Generalization
Imagine a smoothie. If rotten fruit goes in, rotten taste comes out. Data works the same way—garbage in, garbage out. A random sample helps the data taste fresh, letting results extend to the entire population.
Example 1
Scenario
A school of 1{,}200 students wants to estimate the share who prefer school lunches. A computer randomly selects 150 students; 90 say “yes.”
- State the statistic:
- \hat{p} = \frac{90}{150} = 0.60 (60 \%).
- Identify the population: all 1{,}200 students in the school.
- Generalize: Because the sample is random, an estimated 60\% of all students likely prefer school lunches.
SAT®-style Question
Which of the following is a reasonable conclusion?
A) Exactly 60\% of all U.S. teenagers prefer school lunches.
B) About 60\% of students in the school prefer school lunches.
C) 60\% of students in the district prefer school lunches.
D) The statistic cannot estimate any population proportion.
Solution
Choice B. The sample came only from that school, not the district or the nation.
Quick Practice
A city randomly surveys 400 registered voters and finds 52\% favor a new park. To which group may this 52\% be extended?
Because the 400 voters were randomly selected from the city’s registered voters, the 52\% applies only to all registered voters in that city, not the entire state or nation.
Identifying the Correct Population
Reading the Fine Print: Who Was Actually Sampled?
Always check the description. If the sample is “500 subscribers to a fitness blog,” then the population is all subscribers, not all athletes.
Extending Results Only to the Sampled Population
If a claim jumps to a bigger population, the alarm bells should ring.
Example 2
A researcher mails a survey to 2{,}000 residents in one zip code; 250 return it, and 70\% support new bike lanes.
- Sampling method: voluntary response (not random).
- Population: only those who responded.
- Limitation: cannot safely generalize to the whole city because non-respondents may differ.
Common SAT® Trap: The test may ask, “Can the city council conclude that 70\% of all residents support the lanes?” The correct answer: No, because the sample was not random.
Correlation vs. Causation: Spot the Difference
Observational Study vs. Experiment
- Observational study: No imposed treatment. Researchers only watch.
- Experiment: Researchers assign treatments through random assignment.
Common SAT® Traps
- “Ice-cream sales cause sunburns.” Both rise during summer; temperature is the hidden factor.
- “More screen time causes poor sleep.” Maybe, but perhaps students who struggle in class stay up late on screens.
Example 3
Researchers record the hours of exercise and test scores of 200 students. A positive correlation appears.
- Type of study: observational.
- Possible explanation: Active students might also have healthier diets or structured schedules.
- Causal claim? No. Without random assignment, other variables could drive the trend.
Key takeaway: Correlation suggests a connection, but only an experiment can establish causation.
Random Assignment: The Gold Standard for Causal Claims
Definition and Process
Random assignment places participants into groups by chance, balancing out lurking variables.
Why Random Assignment Creates Comparable Groups
When groups start similarly, any later difference is likely due to the treatment.
Extras: Control Groups, Placebos, Blinding
- Control group: gets no treatment or a placebo.
- Placebo: fake treatment to manage expectations.
- Blinding: participants (single-blind) or both participants and researchers (double-blind) do not know group status.
Example 4
A scientist tests a new study app.
- Recruit 120 volunteers from a large high school.
- Randomly assign 60 to use the app (treatment) and 60 to use a regular planner (control).
- After six weeks, average test scores:
- App group: \overline{x}_1 = 84
- Planner group: \overline{x}_2 = 78
- Because the groups were assigned randomly, the 6-point difference is evidence that the app may cause higher scores.
When You DON’T Have Random Assignment
Limitations of Observational Studies
Without assignment, groups may differ in many ways.
Confounding Variables Explained
A confounding variable influences both the explanatory and response variables, muddying interpretation.
How SAT® Questions Frame This Issue
Look for phrases like “participants chose” or “researchers recorded existing behavior.” These usually signal observational studies and no causal claim.
Example 5
Study: Adults who drink two cups of coffee daily live longer.
- Type: observational. People select their coffee intake.
- Confounder: Coffee drinkers might exercise more.
- Causal link? No. The data show an association only.
Practice Tip: Whenever random assignment is missing, pick “cannot establish causation” on the test.
Quick Reference Vocabulary Table
| Term | Definition | SAT® Tip |
| Random sample | A subset chosen so that every member of the population has an equal chance | Allows results to be generalized only to that population |
| Population | Entire group of interest | Often hidden in fine print; underline it |
| Parameter | Numerical measure for a population (e.g., p) | Unknown; estimated with a statistic |
| Statistic | Numerical measure from a sample (e.g., \hat{p}) | Used to guess the parameter |
| Random assignment | Chance process putting subjects into treatment groups | Needed for causal relationship claims |
| Observational study | Researchers do not assign treatments | Shows correlation, not causation |
| Experiment | Researchers assign treatments (ideally randomly) | Can support causal claims |
| Confounding variable | An extra variable influencing both key variables | Watch for in observational studies |
| Causal relationship | A change in one variable produces a change in another | Requires random assignment in SAT® logic |
| Generalizability | Ability to extend results to a wider group | Demands a random sample |
Rapid-Fire Practice Checkpoint
- A random sample of 800 voters in Ohio shows 55\% plan to vote in November. Can this percent be extended to all U.S. voters?
- Researchers randomly assign one group of plants to receive fertilizer A and another group to receive water only. Plant height increases in group A. Does this show that fertilizer A causes growth?
- A survey posted on social media finds 62\% of respondents believe homework should be optional. Is the sampling method random?
Answers
- No. Only to Ohio voters because they were the sampled population.
- Yes, because random assignment in an experiment supports causation.
- No. It is a voluntary response; results cannot be generalized broadly.
Final Takeaways & Test-Day Hacks
- Underline the source of the data in every passage.
- Ask two quick questions:
- Was the sample random?
- Was the assignment random?
- If the answer to both is “yes,” you may claim both generalization and causation. Otherwise, limit the conclusion.
Mastering these ideas turns tricky SAT® statistics questions into easy points.
Soft Call-to-Action
Ready to level up? Try a free, five-question SAT® Statistics Quiz to cement these concepts and track progress.
Keep practicing, stay curious, and good luck on test day!
Sharpen Your Skills for SAT® Math (Digital)
Are you preparing for the SAT® Math (Digital) test? We’ve got you covered! Try our review articles designed to help you confidently tackle real-world SAT® Math (Digital) problems. You’ll find everything you need to succeed, from quick tips to detailed strategies. Start exploring now!
Need help preparing for your SAT® Math (Digital) exam?
Albert has hundreds of SAT® Math (Digital) practice questions, free response, and full-length practice tests to try out.


