
Linear inequalities show up all over the SAT®. Master them, and questions that once felt tricky become quick point-grabbers. The guide below breaks every idea into small, friendly steps and supplies worked examples, practice, and last-minute tips.
What We Review
Why Linear Inequalities Matter on the SAT®
Imagine saving for a concert. You have \$120 and tickets cost \$45 each. How many can you buy and still have at least \$10 for snacks? That single thought turns into an inequality the SAT® loves to test.
The exam usually asks students to:
- Solve single inequalities
- Interpret linear inequalities in everyday language
- Connect tables, graphs, and equations
Therefore, learning how to create and solve linear inequalities, interpret linear inequalities, and connect representations of linear inequalities is time well spent.
What Exactly Is a Linear Inequality?
A linear equation uses an equals sign; a linear inequality uses an inequality sign, but still graphs as a straight boundary line.
Equation: 2x+3=9
Inequality: 2x+3<9
Turning Words into Math: Creating Linear Inequalities from Context
A. Phrase ➔ Symbol Chart
| Words in the problem | Symbol |
| at least | \ge |
| no more than / at most | \le |
| greater than | > |
| less than | < |
B. Translation Checklist
- Define variables with units.
- Replace phrases with symbols.
- Write, then solve.
- Reflect: Does the answer fit real life?
C. Example: Concert Ticket Budget
You have \$120. Each concert ticket costs \$45. You want at least \$10 per purchased ticket left over. How many tickets can you purchase?
Step 1: Let t = number of tickets.
Step 2: Set up the inequality.
Money spent = 45t
Money available for tickets = 120 - 10t
Inequality: 45t \le 120 - 10t
Step 3: Solve.
| Step | Reason |
|---|---|
| 45t \le 120 - 10t | Original inequality |
| 45t \color{red}{+ 10t} \le 120 - 10t \color{red}{+ 10t} | Add 10t to both sides |
| 55t \le 120 | Combine like terms |
| t \le \dfrac{120}{55}\approx 2.18 | Divide both sides by 55 |
Because tickets come in whole numbers, t=2.
D. Interpret the Solution
Buying 2 tickets keeps at least \$10 per ticket for snacks. Any higher amount fails the budget.
Solving Linear Inequalities in One Variable
A. Key Operation Rule
Whenever both sides are multiplied or divided by a negative number, flip the inequality sign.
B. Compound Statements
Sometimes an inequality is sandwiched:
-8 < 2x+4 \le 10Work from the middle outward, keeping operations balanced on all three parts.
C. Graphing Solutions
Graph each part separately, then combine. Closed circles show included endpoints when the symbol is \le or \ge.
D. Example: Compound with Negatives
Solve and graph 12 \ge -3x + 6 > -9 .
| Step | Reason |
|---|---|
| 12 \ge -3x + 6 > -9 | Original compound inequality |
| 12 \color{red}{- 6} \ge -3x + 6 \color{red}{- 6} > -9 \color{red}{- 6} | Subtract 66 from all parts |
| 6 \ge -3x > -15 | Simplify |
| \dfrac{6}{\color{red}{-3}} \le \dfrac{-3x}{\color{red}{-3}} < \dfrac{-15}{\color{red}{-3}} | Divide all parts by −3 (Remember to flip the inequality signs) |
| -2 \le x < 5 | Simplify |
The graph will have a closed circle at -2 and an open circle at 5.
Two Variables, One Inequality: Graphing on the xy-Plane
A. Slope-Intercept vs. Standard Form
Inequalities often appear in slope-intercept form or standard form:
B. Boundary Line: Solid or Dashed?
- Use a solid line for \le or \ge.
- Use a dashed line for < or >.
C. Shading with a Test Point
Pick a simple point not on the line – (0,0) works unless the line passes through it. Substitute. If the inequality is true, shade that side.
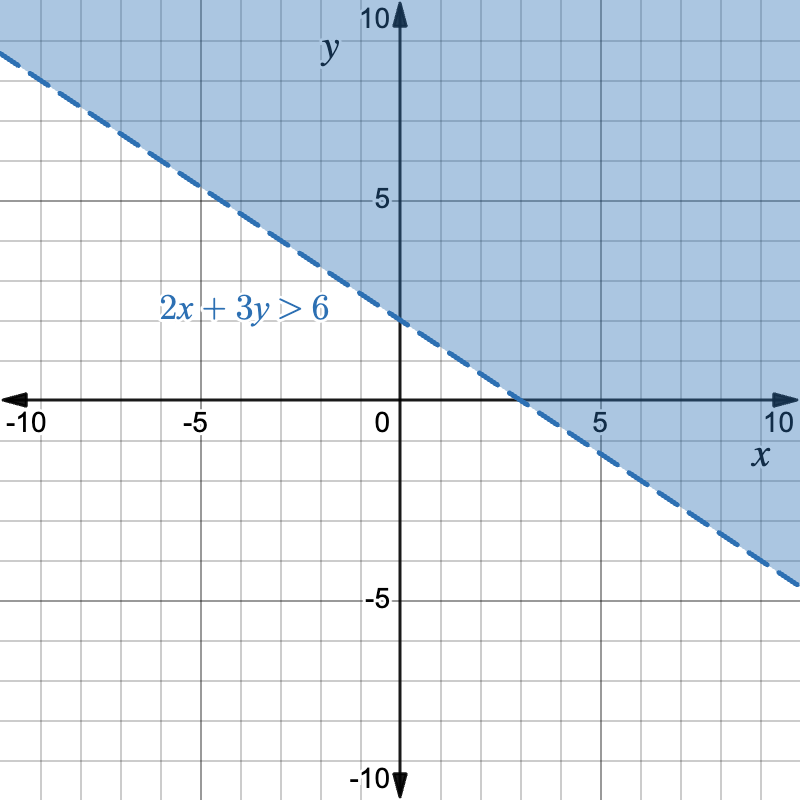
D. Example
Graph 2x + 3y > 6 .
Step 1: Convert to slope-intercept form.
3y > -2x + 6 \quad\Rightarrow\quad y > -\dfrac{2}{3}x + 2Step 2: Draw a dashed line for y = -\dfrac{2}{3}x + 2.
Step 3: Test (0,0):
0 > -\dfrac{2}{3}(0)+2 \rightarrow 0 >2 False!Therefore, shade the half-plane that does NOT include the origin.
Connecting Representations: Table ⇄ Equation ⇄ Graph
A. Building a Table From an Inequality
Pick x-values, solve for y using the boundary equation. Then decide which rows satisfy the inequality.
B. Recognizing Slope & Intercepts
Differences in the y-column give the slope, and the x-value where y becomes 0 offers the x-intercept.
C. Moving From Graph Back to Inequality
- Identify the boundary line’s equation in any convenient form.
- Decide on a solid or dashed line.
- Test a point to pick shading direction, then attach the correct symbol.
D. Example
Table of points on a dashed line:
| x | y |
| 0 | 3 |
| 3 | 1 |
| 6 | -1 |
Step 1: Calculate the slope.
m = \dfrac{-1-1}{6-3} = \dfrac{-2}{3} = -\dfrac23Step 2: Use point-slope form, and then convert to slope-intercept form:
y-1 = -\dfrac23(x-3) ;\Rightarrow; y = -\dfrac23x + 3Step 3: A dashed line and shading below the line means the symbol is <.
Final inequality: y < -\dfrac23x + 3
Interpreting Parts of an Inequality
A. Meaning of Pieces
In y \le 0.5x + 3, the 0.5 is the rate of increase (slope). The 3 is the starting value (y-intercept).
B. Spotting Feasible Ranges
Coefficients show how fast variables trade off. Recognizing this saves time.
C. Single Point Insight
A point tells three things: whether it’s on the boundary, inside the shaded half-plane, or outside.
D. Example
Does (4,1) satisfy y \le 0.5x + 3 ?
Check: 1 \le 0.5(4) + 3 = 5 True!
Therefore, the point sits in the solution region. On a graph, it lies below or on the boundary.
Quick Reference Chart: Essential Vocabulary
| Term | Definition |
| Boundary Line | The straight line that separates solutions from non-solutions. |
| Half-Plane | One side of the boundary line, containing all points that satisfy (or do not satisfy) the inequality. |
| Compound Inequality | Two inequalities linked by “and” or “or.” |
| Feasible Region | The overlap of all shaded half-planes in a system; every point here works for every inequality. |
| Test Point | A simple point used to decide which half-plane to shade. |
| Flip the Sign | Change < to > (or vice versa) when multiplying or dividing by a negative. |
Practice Questions
- Solve and graph: 5 - 2x > 9
- Write an inequality: “The sum of a number n and 12 is no more than 7.”
- Which of the following points satisfies both y \ge -x + 1 and y < 2x + 4 ?
- A. (0,0) B. (2,2) C. (3,5) D. (-2,4)
Answer Key
- x< -2 . Graph has an open circle at –2, and shading to the left.
- n + 12 \le 7
- B
Last-Minute Tips & Takeaways
- Watch the negative-sign trap; flip the symbol after multiplying or dividing by a negative.
- Always label axes and shading on scratch paper; clarity prevents sign errors.
- Use the test-point shortcut. The origin is fastest unless the line passes through it.
- Master these steps, and linear inequalities become one of the fastest wins on the SAT®.
By practicing how to create and solve linear inequalities, interpret linear inequalities, and connect representations of linear inequalities, students gain speed and confidence. Keep the guide handy, work through the examples, and watch scores rise.
Sharpen Your Skills for SAT® Math (Digital)
Are you preparing for the SAT® Math (Digital) test? We’ve got you covered! Try our review articles designed to help you confidently tackle real-world SAT® Math (Digital) problems. You’ll find everything you need to succeed, from quick tips to detailed strategies. Start exploring now!
Need help preparing for your SAT® Math (Digital) exam?
Albert has hundreds of SAT® Math (Digital) practice questions, free response, and full-length practice tests to try out.


