Data plays a crucial role in almost every aspect of modern life. Whether choosing a favorite music playlist or using a navigation app, decisions often rely on gathering, analyzing, and transforming bits of information. Therefore, the ability to process and use data effectively has become a powerful life skill. Programs such as spreadsheets and databases can quickly sort through large collections of information, helping users discover hidden trends. As a result, understanding how data filtering works is especially important. This article focuses on how to use programs for data filtering, how insights from data can be extracted, and why recognizing patterns is essential for informed decision-making.
What We Review
Understanding Data
Data is any set of facts or statistics collected for reference or analysis. Think of a restaurant receiving customer feedback forms with ratings and comments—these forms represent specific pieces of information. Therefore, this feedback can help owners decide which food items to improve. Generally, data can be qualitative (words and descriptions) or quantitative (numbers and measurements). For example, a survey asking for “favorite lunch menu item” yields qualitative data, whereas “rate this meal from 1 to 5” is quantitative. However, both types can be equally useful for decision-making. Moreover, organizing data makes it far easier to spot opportunities, understand trends, and make logical choices.
What Are Data Filtering Systems?
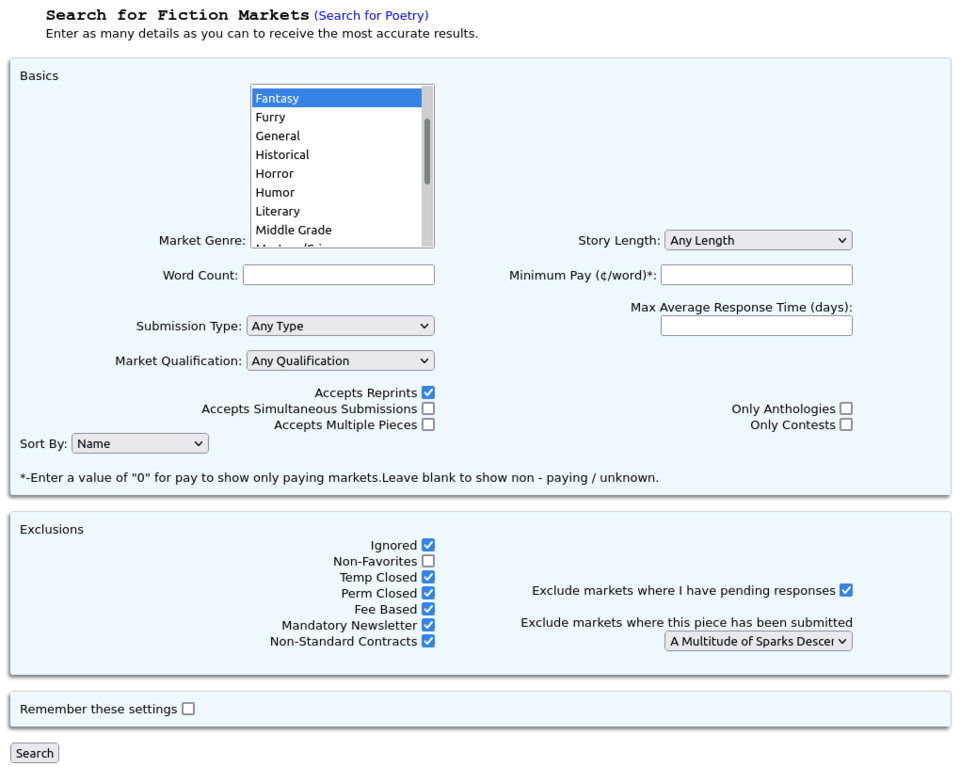
Data filtering systems help users focus on relevant information by removing unnecessary details. For instance, an inbox can be filtered to show only messages from teachers or classmates, hiding other promotional emails. This process is like sifting flour when baking: the lumps get separated from the finer powder, leaving only what is needed. Similarly, online shopping websites use data filtering to show specific products based on filters such as price, size, or color. As a result, data filtering systems allow users to zoom in on what truly matters. Instead of wading through massive amounts of data, these systems determine which facts require attention.
Using Programs to Filter Data
Programs such as spreadsheet tools and databases provide simple yet powerful ways to filter data. In a spreadsheet, individual rows can be examined for specific criteria. For example, if a teacher wants to see only students who scored above 80 on a test, a filter can instantly show those rows. Here’s a brief example showing how a spreadsheet function might help:
- Enter student names and scores in columns A and B.
- Select the dataset area.
- Use the Filter option (often found under “Data”).
- Choose “Score > 80” as the filtering rule.
The spreadsheet then shows only the rows matching “score > 80.” Therefore, the teacher easily identifies students needing recognition or extra help.
Extracting Information from Data
Programs do more than just filter data; they can also transform it. For instance, doubling every element in a list might mean multiplying sales data by 2 if forecasting for a future scenario. Meanwhile, filtering specific values helps keep the relevant parts of the data. Combining data (such as summing up sales records to find monthly totals) also reveals meaningful information. Moreover, many tools allow the creation of charts and graphs to visualize patterns. For example, if a student wants to see how much time is spent on homework each day, a spreadsheet can sum daily readings or math exercises, then produce a simple bar chart. These transformations are typically performed in an iterative way, meaning the process can be repeated or refined over and over until clear insights from data emerge.
Real-World Applications of Data Filtering
Many fields rely on data filtering to uncover valuable insights. In healthcare, filtering patient records based on specific symptoms helps doctors focus on probable diagnoses. In marketing, companies often filter social media posts to identify consumer preferences or complaints. As a result, marketing campaigns become more targeted. Meanwhile, school administrators may filter attendance records to quickly locate students who have missed a certain number of days. These examples show how filtering systems can transform large amounts of data into more manageable, actionable sets. Therefore, it’s no surprise that mastering data filtering is a must-have skill for anyone hoping to excel in today’s data-driven world.
Recognizing Patterns in Data
Filtering data is only the first step. The next step involves recognizing patterns that appear once irrelevant data has been set aside. For example, consider the cafeteria manager who filters meal purchase data by time of day and notices that fruit snacks sell more in the afternoon. This trend might lead the manager to order extra fruit snacks for those post-lunch hours. Similarly, a website manager might filter user traffic data by region, revealing that a majority of evening visitors reside in a specific country. As a result, the site’s language or content might be customized to better serve that audience. Observing these patterns allows people to make decisions backed by solid data.
Communicating Insights from Data
Once patterns are uncovered, the final step is to share these insights with others. Tables and diagrams make findings easier to understand at a glance. For instance, bar charts can quickly compare values, while line graphs can show changes over time. Likewise, well-labeled spreadsheets allow team members to spot trends such as rising costs or improving grades. Therefore, solid visualization makes complex data more approachable. Moreover, effectively communicating insights can drive better decisions in group settings. For example, a carton manufacturer might show a chart indicating monthly material usage to management, leading to discussions about cutting costs. By presenting data through clear visual tools, teams gain knowledge and discover new ways to improve.
Conclusion
Programs such as spreadsheets are essential for data filtering, allowing users to focus on the most relevant records. Through iterative processes like transformation and combination, data can be turned into practical insights. Moreover, recognizing patterns and effectively communicating those findings amplifies the impact of data-driven decisions. Therefore, exploring these tools and techniques is an excellent way to develop skills that will be valuable in any career path. Everyone can benefit from learning how to filter, transform, and visualize data. Taking the time to practice these techniques will ultimately lead to deeper knowledge and improvements in problem-solving, both inside and outside the classroom.
Quick Reference Chart
- Algorithm – A step-by-step procedure for solving a problem
- Data Filtering – A process of removing unnecessary information to focus on specific records
- Database – A structured system for organizing and managing data
- Insights from Data – Knowledge or patterns gained by analyzing and interpreting data sets
- Iterative Process – A repeating cycle of steps (such as filtering, combining, and visualizing) aimed at refining information
- Quantitative Data – Numerical information (like scores or amounts) that can be measured
- Qualitative Data – Descriptive information (like comments or labels) that explains characteristics or qualities
- Spreadsheet Program – A software tool (like Excel or Google Sheets) used for data organization, calculations, and analysis
- Visualization – Displaying data in charts, graphs, or other visuals to make insights clear
- Search Tools – Functions or programs that help find specific data efficiently
Sharpen Your Skills for AP® Computer Science Principles
Are you preparing for the AP® Computer Science Principles test? We’ve got you covered! Try our review articles designed to help you confidently tackle real-world AP® Computer Science Principles questions. You’ll find everything you need to succeed, from quick tips to detailed strategies. Start exploring now!
- AP® Computer Science Principles 2.1 Review
- AP® Computer Science Principles 2.2 Review
- AP® Computer Science Principles 2.3 Review
Need help preparing for your AP® Computer Science Principles exam?
Albert has hundreds of AP® Computer Science Principles practice questions and full-length practice tests to try out.


