Data is everywhere—on phones, in classrooms, and across the internet. However, collecting random numbers or text doesn’t immediately provide insights. Therefore, computer scientists rely on tools and programs to process data and extract meaningful information. This conversion of raw data into organized, meaningful information is vital in many fields, from healthcare to business. As a result, understanding the difference between data and information—and the concept of data vs information—lays the foundation for more advanced concepts, such as analyzing trends and making informed decisions. Throughout this article, explore how data are gathered, processed, and transformed into valuable information.
What We Review
Understanding Data vs. Information
Definition of Data
Data consists of raw facts, figures, or measurements. These raw pieces of information have not yet been interpreted or placed in context. Therefore, data by itself might appear as random numbers, words, or symbols. For example, a list of numbers like 2, 5, 7, 10 is simply data. It has no meaning until it is connected to a larger picture or context.
Definition of Information
By contrast, information emerges when data is processed, organized, or structured in a way that provides meaning or value. Imagine discovering that 2, 5, 7, 10 are the ages of four students in a math club. This new insight transforms the raw numbers into relevant information. As a result, understanding “data vs information” is essential since turning data into information often reveals patterns, trends, and solutions.
Example
- Raw Data: A list of numbers such as 2, 5, 7, 10
- Information: Recognizing that these numbers represent the ages of four students
The Role of Metadata
What is Metadata?
Metadata is often described as “data about data.” In other words, metadata provides details that help users find, categorize, and understand primary data. It does not change the main content but adds important clues. Therefore, metadata plays an essential role in organizing digital files and helping computers and people manage information more efficiently.
Example of Metadata
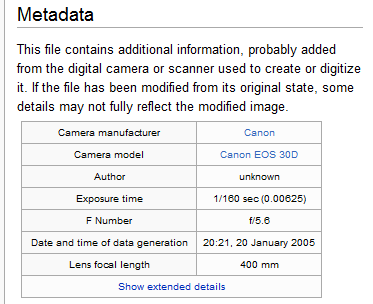
For a photograph:
- Data: The image itself (such as a .jpg file).
- Metadata: Date taken, camera settings, file size, and even location.
These metadata details help photographers and archivists sort through thousands of images more quickly. As a result, they can locate pictures based on date or subject. Changes made to metadata do not alter the original image, proving that metadata is purely supplementary.
Difference Between Data and Metadata
While data represents the primary content (e.g., the photograph), metadata holds descriptions about that content. This difference between data and metadata matters because metadata allows data to be categorized, searched, and utilized efficiently. Therefore, when managing large datasets, always pay attention to the supplemental information that metadata provides.
Data Processing Challenges
Common Challenges in Processing Data
Working with data can be challenging due to issues like missing fields, inconsistent formats, and the need to combine multiple sources. For instance, when students complete surveys, they might abbreviate words differently or leave certain questions unanswered. As a result, these irregularities complicate any attempts at drawing accurate conclusions.
What is Data Cleaning?
Data cleaning is the process of correcting or removing incomplete, invalid, or inconsistent data to ensure uniformity. Therefore, consistent data enhances the reliability of any insights that emerge from analysis. This process also helps reduce bias because it standardizes entries. However, simply collecting more data does not automatically eliminate bias. Careful attention to cleaning and consistency is essential.
Example of Data Cleaning
If a dataset tracks country names and contains “USA,” “Usa,” and “U.S.A,” cleaning would standardize them to “United States.” Thus, all references to that country align under the same entry, preventing confusion and skewed results.
Identifying Patterns and Correlation
Finding Trends in Data
Once data is properly cleaned and organized, patterns often emerge. Trend analysis can reveal how factors change over time or how different variables relate to each other. For example, a school might track student study hours throughout a semester and notice that grades typically rise with more study time. Therefore, identifying trends helps educators, businesses, and researchers make data-driven decisions.
Understanding Correlation
Correlation measures the relationship between two variables. If they move in tandem, they may be correlated. However, correlation does not equal causation. Further research is needed to determine whether one variable causes the other to change. Therefore, it is essential to investigate and confirm any assumptions about why the data appears related.
Example of Correlation
In warmer months, ice cream sales increase, and so do swimming pool visits. Seeing these two variables rise together suggests a correlation. However, the higher temperature is likely affecting both variables, which means ice cream sales do not cause more pool visits. As a result, never assume correlation automatically means one factor causes the other.
The Importance of Combining Data Sources
Why Combine Data?
No single dataset often holds the full story. Sometimes, multiple datasets are needed to get a complete picture. Therefore, combining data from diverse sources can reveal a more accurate understanding. This approach is common in fields like healthcare and marketing, where analyzing numerous metrics leads to more informed decisions.
Challenges of Using Multiple Sources
When data come from different places, the formats and data quality may vary. One database might use abbreviations, while another uses full words. As a result, the task of merging these datasets requires attention to detail, including possible data cleaning for consistency. Overlooking these disparities can lead to confusing or inaccurate outcomes.
Example
A researcher investigating educational achievement might combine school performance data with demographic data to see if certain regions need more resources or if specific teaching methods yield better results. However, these diverse data sources must be carefully standardized, or conclusions can become flawed.
Practical Applications
Using Data in Real Life
Data analysis is essential in nearly all industries. Businesses harness it to optimize marketing strategies, while healthcare professionals study patient records to improve treatments. Likewise, schools and universities examine attendance data or test scores to create better learning environments. As a result, data analysis often drives innovation.
Example
A hospital might use data analysis to improve patient care. First, doctors gather patient information (e.g., medical history and test results). Then, they combine it with metadata such as appointment dates and hospital capacity details. Next, they analyze this information to discover patterns and insights to tailor patient treatments. Therefore, data-driven decision-making frequently leads to better health outcomes.
Conclusion: Data vs Information
Extracting information from data is a core skill in computer science and beyond. Put simply, data represents raw, unprocessed facts, while information emerges once those facts are given context and organized meaning. Metadata further enriches data by describing and categorizing the main content. However, these steps are rarely easy due to challenges like data cleaning and combining multiple sources. Therefore, practicing with real-world datasets helps to develop confidence in handling these common issues.
By consistently refining data and looking for correlations, it becomes easier to spot trends that might solve real problems. While correlation does not always imply causation, it is a useful clue when conducting research. In many cases, combining different data sources uncovers hidden relationships that might otherwise remain unseen. Keep exploring these concepts, because learning to process data effectively can lead to discoveries that shape our future.
Quick Reference Chart: Vocabulary and Definitions
- Data – Raw facts and figures that represent a phenomenon
- Information – Data that has been processed and organized to provide meaning
- Metadata – Data about data; additional information for primary data
- Data Cleaning – The process of correcting or removing inaccurate records
- Correlation – A statistical relationship between two variables
- Causation – The action of causing something; not necessarily implied by correlation
Sharpen Your Skills for AP® Computer Science Principles
Are you preparing for the AP® Computer Science Principles test? We’ve got you covered! Try our review articles designed to help you confidently tackle real-world AP® Computer Science Principles questions. You’ll find everything you need to succeed, from quick tips to detailed strategies. Start exploring now!
Need help preparing for your AP® Computer Science Principles exam?
Albert has hundreds of AP® Computer Science Principles practice questions and full-length practice tests to try out.


