
What We Review
Introduction
Dose-response curves play an essential role in AP® Environmental Science, particularly when evaluating how organisms and populations respond to different levels of toxins or drugs. These curves illustrate the relationship between the dose of a substance and the resulting effect on an organism or mortality rate in a population. Therefore, understanding a dose-response curve helps students predict safe exposure levels, determine how particular chemicals influence living systems, and identify broader ecological impacts.
However, students sometimes find these curves intimidating. The concept often appears alongside toxicology, risk assessment, and public health discussions. Furthermore, dose-response curves support policymaking by informing acceptable exposure limits for substances such as pesticides and industrial chemicals. This article breaks down the topic into manageable parts, clarifying why dose-response curves matter and how to interpret them within an environmental science context.
What Is a Dose Response Curve?
A dose response curve is a graphical representation of the effect of a substance on a living organism or population as the administered dose increases. In environmental science, researchers use these curves to observe how organisms respond over time to varying concentrations of pollutants, drugs, or chemicals. Moreover, the curve often highlights a threshold below which observable effects may be minimal.
Although dose response curves are common in pharmacology, they are equally significant in environmental science. For instance, understanding how a pesticide affects the mortality rate of insects can help scientists determine if that pesticide poses a risk to endangered species or beneficial pollinators. Consequently, dose response curves guide environmental policies, shaping global approaches to chemical regulation and public safety.
The Components of a Dose Response Curve
Dose
The “dose” is the amount of a substance administered to an organism at one time. In environmental science, doses may be measured in milligrams of toxin per kilogram of an organism’s body weight. However, some researchers track the concentration of a toxin in water or soil. In any case, the goal is to quantify the substance so its impact can be compared across different populations or environmental conditions.
Response
The “response” represents how the organism or population reacts to the dose. Responses can vary widely, including symptoms of toxicity, physiological changes, or mortality rates. The dose response curve visually matches each dose level with its corresponding outcome. Therefore, it often highlights the severity of effects as doses increase. If multiple species are tested, the response may differ, which underscores the complexity of ecosystems and the importance of studying multiple organisms.
Curve Shape
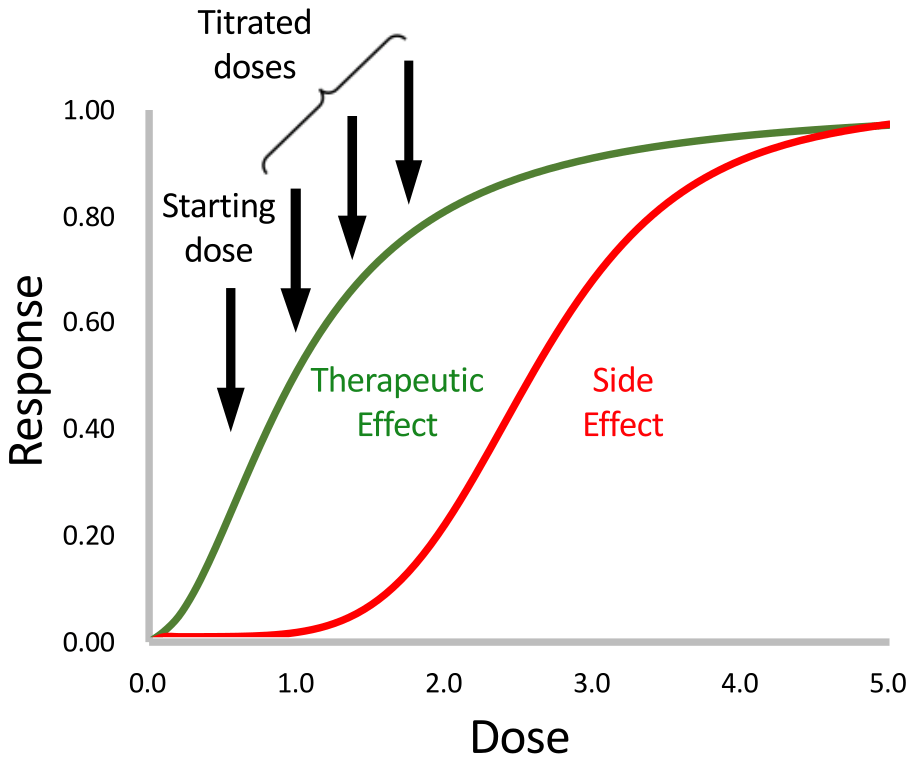
The shape of a dose response curve is typically linear, threshold-based, or sigmoidal. A linear curve suggests a direct, proportional relationship between dose and effect. In contrast, a threshold curve shows no effect until a certain dose is reached, at which point effects become significant. By comparison, a sigmoidal curve (often an S-shaped curve) indicates low response at low doses, a steep response as the dose escalates, and a plateau at high doses where effects may not increase further. Notably, these shapes can help determine whether small increases in dose cause large shifts in response or if there is a “safe zone” below a threshold dose.
Plotting a Dose Response Curve: A Step-by-Step Example
Understanding how to plot and interpret a dose response curve is crucial. Below is a step-by-step scenario involving fruit flies and a hypothetical toxin.
- Define the Doses
- Suppose a laboratory uses four dose levels of a new toxin: 0 mg (control), 1 mg, 5 mg, and 10 mg. These doses are given to different sets of fruit flies. Therefore, each group receives a known quantity of the toxin that allows scientists to test for gradual changes in mortality rate.
- Measure the Responses
- After 24 hours, scientists record how many fruit flies remain alive. Next, they convert the data into a mortality rate, which is the percentage of fruit flies that died after exposure. For instance, if 50 out of 100 dies at the 5 mg dose, the mortality rate is 50%.
- Create the Graph
- Place the dose on the x-axis (represented by 0 mg, 1 mg, 5 mg, and 10 mg) and the response (mortality rate) on the y-axis. Plot each data point to visualize how mortality changes as dose increases. As a result, you might notice a very low mortality rate at 1 mg and a significantly higher rate at 10 mg.
- Analyze the Shape of the Curve
- Finally, connect the points in a way that most accurately reflects the data distribution. Examine whether the shape is linear (a straight line), threshold-based (little effect until a certain point), or sigmoidal (S-shaped). This shape reveals how much of the toxin is needed to produce a substantial effect on the fruit fly population.
Interpreting Dose Response Curves
Threshold Effects
One of the most critical aspects of dose response curves is identifying a threshold. A threshold is the lowest dose at which a measurable effect first becomes evident. Below this point, the organism may appear unaffected, or the effect might be too small to detect. However, once the threshold is crossed, the response typically increases, either gradually or more abruptly. In environmental science, thresholds are vital for establishing guidelines that protect human health, wildlife, and ecosystems from harmful exposure.
Median Lethal Dose (LD50)
Another key metric is the median lethal dose, denoted LD_{50}. This is the dose at which 50% of a test population is killed. For example, if testing a pesticide on insects, the LD_{50} tells researchers the amount of pesticide that will kill half of the insect population. Therefore, LD_{50} values help compare toxicity levels across different substances. A smaller LD_{50} indicates a more toxic substance, because it takes a lower dose to reach 50% mortality.
Recognizing these definitions—threshold and LD_{50}—is essential when interpreting dose response curves. These concepts offer a standard way for scientists to compare toxic effects across studies and determine allowable exposure levels in real-world scenarios.
Applications of Dose Response Curves
Dose response curves inform numerous fields related to public and environmental health. For instance, regulators evaluate pesticide safety using dose response data to ensure non-target species, such as bees, remain safe. Additionally, pharmaceutical developers employ dose response curves to design effective yet safe medication dosages before introducing drugs into the market. Furthermore, environmental policymakers rely on these curves to set maximum allowable concentrations of pollutants in air, water, and soil.
In the broader context of AP® Environmental Science, dose response curves intersect with topics like population growth models. High mortality rates at relatively low doses can hinder population growth in crucial species, upsetting the balance within an ecosystem. Consequently, studying these curves supports improved environmental management and highlights how one factor, such as a toxin, can ripple through entire landscapes.
Considerations and Limitations
Although dose response curves provide valuable insights, several factors can affect their accuracy. First, not all organisms respond the same way due to genetics, age, gender, and health status. By contrast, environmental factors like temperature or pH can modify the impact of a toxin, changing the shape of the curve. Therefore, one should consider the specific organism and environment when generalizing findings.
Additionally, real-world scenarios can involve exposure to multiple substances simultaneously. In these cases, interactions between chemicals may amplify or diminish the observed response. For example, a certain drug may become more toxic in combination with another substance. Meanwhile, ethical and practical constraints often limit how researchers design toxicity studies, resulting in only approximate predictions for complex natural ecosystems.
Conclusion
Dose response curves are indispensable tools for understanding how different levels of toxins or drugs can shape the health outcomes of organisms and entire populations. By revealing threshold effects, LD_{50} values, and overall response patterns, these curves guide scientists, healthcare providers, and policymakers in making informed decisions. Grasping the fundamentals of dose response can deepen one’s understanding of toxicology, risk assessment, and ecological balance. Therefore, students benefit from practicing with example data sets, exploring variations in curve shape, and examining the limitations of standard testing.
Ultimately, dose response curves underscore the interconnectedness of environmental science topics. They reinforce the principle that even small amounts of a toxic substance can have large consequences—sometimes altering population growth, biodiversity, and ecosystem stability. By continuing to study these curves and exploring advanced applications, you build a strong foundation for further work in environmental science.
Key Vocabulary
- Dose: The amount of a substance that is administered to an organism at one time.
- Response: The effect an organism or population shows after exposure to a particular substance.
- Mortality Rate: The percentage of a population that dies under specified conditions.
- LD_{50}: The dose of a substance at which 50% of the exposed population dies.
- Threshold Effect: The minimum dose below which no measurable adverse response is observed.
- Toxin: A poisonous substance that can harm or kill organisms upon exposure.
Sharpen Your Skills for AP® Environmental Science
Are you preparing for the AP® Environmental Science test? We’ve got you covered! Try our review articles designed to help you confidently tackle real-world AP® Environmental Science problems. You’ll find everything you need to succeed, from quick tips to detailed strategies. Start exploring now!
- AP® Environmental Science: 8.10 Review
- AP® Environmental Science: 8.11 Review
- AP® Environmental Science: 8.12 Review
Need help preparing for your AP® Environmental Science exam?
Albert has hundreds of AP® Environmental Science practice questions, free response, and full-length practice tests to try out.


