Limits are the launchpad for both derivatives and integrals. Therefore, a solid grip on limits will power every later topic in AP® Calculus. Today’s spotlight is the graphical and numerical approach to evaluating limits. These twin techniques build intuition and speed, two skills prized on the AP® exam.
Throughout this lesson, phrases such as graphical limits, finding limits graphically, and finding limits algebraically appear often. Keep an eye out for them.
What We Review
Limits in Plain Language
- A limit tells “where a function is heading” as moves toward some number .
- A two-sided limit looks at both the left and right approach, while a one-sided limit isolates just one direction.
- Notation refresher: If the left‐hand limit and right‐hand limit match, then the limit exists; otherwise, it does not.
Graphical Limits: Reading the Story Told by the Curve
The Visual Toolbox
When analyzing a graph, scan for:
- Open dots (holes) and closed dots (actual points)
- Vertical or horizontal asymptotes
- Jumps where the curve hops to a new height
- Smooth sections that signal continuity
Step-by-Step Example #1 (Piecewise Graph)
Consider the graph of shown below. (Imagine a filled circle at and an open circle at ; the left branch heads to the open circle, and the right branch starts at the filled circle.)
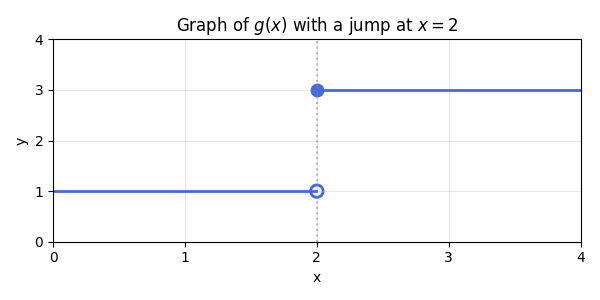
Task: Evaluate
Solution:
- First, find the left-hand limit. As approaches 2 from the left, moves toward 1.
- Next, find the right-hand limit. Approaching from the right, moves toward 3.
- Because 1 ≠ 3, the two-sided limit does not exist (DNE).
Quick Tips for Finding Limits Graphically
- Trace the curve with your finger from both sides.
- Check open vs. closed dots carefully.
- Note any vertical asymptote; if the height shoots up or down without bound, expect .
- Verify both one-sided limits before declaring DNE.
Numerical Limits: Tables That Talk
Building a “Zoom-In” Table
A numerical or tabular method zooms in on by choosing values like and their right-hand twins. Watching the -values settle reveals the limit.
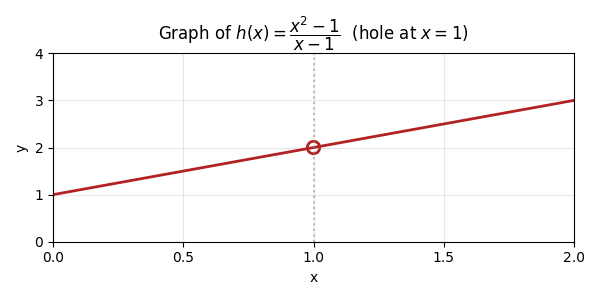
Step-by-Step Example #2 (Rational Function with a Hole)
Investigate near .
1. Create a table.
| x | 0.9 | 0.99 | 0.999 | 1.001 | 1.01 | 1.1 |
| h(x) | 1.9 | 1.99 | 1.999 | 2.001 | 2.01 | 2.1 |
2. Observe the -values. They trend toward 2.
3. Therefore, even though is undefined (hole).
Technology Note
A graphing calculator’s tbl feature quickly generates such tables. However, double-check that you are closing in symmetrically from both sides.
Bridging Representations
A function’s graph, table, and algebraic rule all describe the same limit. Being fluent in switching viewpoints is an AP® skill.
Mini Example #3
- Numerical finding: A table shows approaches 4 as .
- Verbal statement: “The limit of as approaches 3 is 4.”
- Graphical confirmation: On the graph, both branches head toward the point , though a hole may exist there.
Quick Contrast: Finding Limits Algebraically vs. Graphically/Numerically
Sometimes algebra saves time; other times a visual view prevents errors.
Step-by-Step Example #4
Given , find
Algebraic Method
- Factor numerator: .
- Cancel (only valid for ): results in .
- Substitute : limit equals 6.
Graphical/Numerical Check
Plot or table confirms values near 3 stay near 6. Therefore, algebra and graph agree.
When to choose each:
- Algebra: removable holes, simple rational forms.
- Graphical/Numerical: jump discontinuities, absolute-value pieces, or tricky radicals where algebra feels messy.
Common Pitfalls and How to Dodge Them
- Misreading open vs. closed points: zoom in on the dot style.
- Picking x-values that are not close enough: halve the step size until the y-values stabilize.
- Forgetting one-sided analysis: always test both directions before concluding DNE. Meanwhile, label answers clearly as left-hand, right-hand, or two-sided.
Quick Reference Chart: Must-Know Vocabulary
| Term | Definition/Key Feature |
| Limit | Number that approaches as approaches |
| One-sided limit | Limit from only left () or right () |
| Removable discontinuity | Hole that can be “fixed” by redefining a single point |
| Jump discontinuity | Left-hand and right-hand limits differ; graph literally jumps |
| Infinite limit | Function grows without bound; notation |
| Continuity | Function is connected with no breaks at |
| Vertical asymptote | x-value where function shoots to |
| Numerical limit | Estimate based on a table of values |
| Graphical limits | Limits determined by reading a graph |
Conclusion
Graphical and numerical approaches to evaluating limits give rapid insight and a safety net when algebra stalls. Consequently, toggling among tables, graphs, and formulas deepens understanding and raises AP® exam confidence. Next, practice switching representations until each feels natural. Limits will then become an ally, not an obstacle, as calculus adventures continue.
Sharpen Your Skills for AP® Calculus AB-BC
Are you preparing for the AP® Calculus exam? We’ve got you covered! Try our review articles designed to help you confidently tackle real-world math problems. You’ll find everything you need to succeed, from quick tips to detailed strategies. Start exploring now!
Need help preparing for your AP® Calculus AB-BC exam?
Albert has hundreds of AP® Calculus AB-BC practice questions, free responses, and an AP® Calculus AB-BC practice test to try out.


