What We Review
Introduction
Human population dynamics is the study of how and why population sizes change over time. It analyzes factors such as birth rates, death rates, and carrying capacity, revealing how communities evolve in size and structure. Understanding these factors is crucial in AP® Environmental Science because human populations have a direct impact on resource usage, waste production, and overall ecological balance.
Therefore, exploring human population trends helps explain why some nations grow rapidly while others stabilize or even shrink. This knowledge also highlights the importance of sustainable resource management. From analyzing birth rates to applying the Rule of 70, students can gain valuable insights into how population dynamics shape the global environment, including the availability of vital resources such as food, water, and energy.
Understanding Human Population Growth
Population growth refers to the increase in the number of individuals over a given time period. In human populations, growth is influenced by factors including birth rates, death rates, infant mortality rates, family planning, and societal norms such as the postponement of marriage. These elements interact with each other, creating variations in a population’s growth pattern and contributing to overall population dynamics.
Consequently, when more people are born than die, the population tends to increase. In areas with sufficient healthcare, nutrition, and education, birth rates might stay high, but death rates may drop significantly. However, this often leads to rapid population growth if not balanced by declining birth rates. By contrast, in regions where healthcare is lacking, high death rates may offset high birth rates, resulting in slower or stable growth.
Example of Factors Influencing Growth
Suppose a country invests heavily in family planning programs, which lower its birth rate over several years. At the same time, better nutrition reduces the death rate. Over time, the population might continue expanding, but at a slower pace than before. Step by step:
- Identify the initial birth rate (number of births per 1,000 people).
- Determine the new, lower birth rate after family planning is introduced.
- Measure the existing death rate, which might have decreased due to improved healthcare.
- Calculate the difference between the (new) birth rate and death rate over a specified period.
- Estimate the resulting population change based on these updated figures.
Birth and Death Rates
Birth rate is the number of live births per 1,000 people in a year, while death rate is the corresponding number of deaths. These rates form two primary components of demographic studies. High birth rates accompanied by high death rates typically result in steady—or slowly increasing—population sizes. However, if the death rate declines faster than the birth rate, population growth can accelerate.
Example: Analyzing a Hypothetical Country
Assume Country A has a birth rate of 20 births per 1,000 people per year and a death rate of 5 deaths per 1,000 people per year. To estimate its rate of natural increase (RNI):
- Note the birth rate (20).
- Subtract the death rate (5) from the birth rate (20).
- The difference is 15 (20−5 = 15).
- Interpret 15 as 1.5% growth because 15 per 1,000 is equivalent to 1.5 per 100.
Consequently, Country A’s population is expected to grow faster than a region where the difference between birth and death rates is smaller.
Infant Mortality Rate
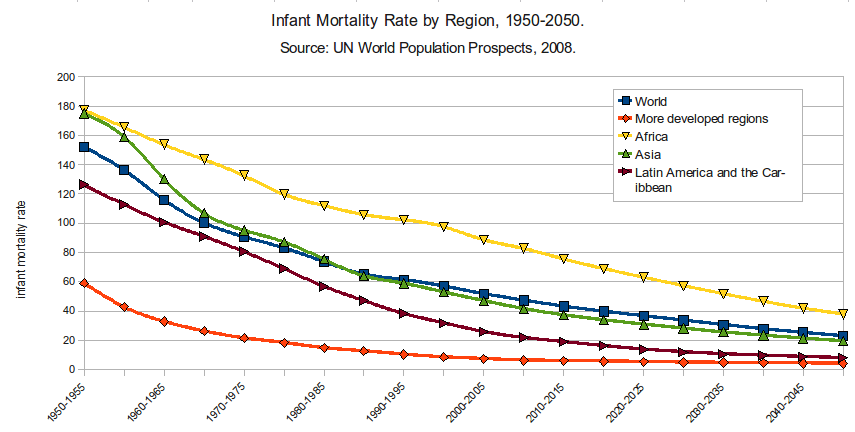
Infant mortality rate measures the number of infants (under one year old) who die per 1,000 live births. This rate is significant because it reflects not only healthcare quality but also nutrition, sanitation, and access to resources. Regions with high infant mortality rates often see higher birth rates as families may have more children to compensate for potential infant losses.
Example: Global Comparisons
Consider two nations: Country X and Country Y.
- Country X: infant mortality rate of 3 deaths per 1,000 live births.
- Country Y: infant mortality rate of 40 deaths per 1,000 live births.
Country Y’s higher rate typically indicates lower healthcare quality or reduced access to clean water. Therefore, its population might compensate with higher birth rates. Over time, improving healthcare in Country Y would reduce its infant mortality rate and might also lead to adjustments in birth rates.
Carrying Capacity and Malthusian Theory
Carrying capacity refers to the maximum number of individuals an environment can sustain without permanently degrading the ecosystem. According to Malthusian theory, human populations tend to grow exponentially, but resources such as food often grow at a slower (arithmetical) rate. Consequently, shortages arise once the population exceeds the environment’s ability to provide resources.
Example: Calculating Carrying Capacity
Imagine a region’s farmland can support 10,000 people based on current technology and resource availability. If the population unexpectedly rises to 15,000, competition for food increases, and the environment may degrade. Over time, soil fertility could suffer, and birth rates might adjust as resource scarcity impacts family size decisions.
A simplified way to model potential carrying capacity is to assess the resource base. For instance:
- Estimate annual food production (e.g., 1,000,000 kilograms of grains).
- Calculate average individual food consumption needs (e.g., 100 kilograms of grains per person per year).
- Divide annual production by individual consumption: \frac{1,000,000 \text{ kg}}{100 \text{ kg/person}} = 10,000 \text{ people}
If the population exceeds 10,000, the produce may become insufficient.
Density-Independent vs. Density-Dependent Factors
Two categories of limiting factors affect population growth: density-independent and density-dependent. Density-independent factors, such as storms and droughts, impact populations regardless of how many individuals live in an area. In contrast, density-dependent factors, such as disease transmission and food availability, intensify as a population grows more crowded.
Example: Natural Disaster as a Density-Independent Factor
A hurricane might strike a coastal city, causing damage and loss of life. This event reduces the population size drastically, no matter how dense it was initially. Recovery may depend on how quickly the surviving population can rebuild and access resources. Because no one can fully control these events, their effects are considered independent of population density.
Calculating Doubling Time: The Rule of 70
In AP® Environmental Science, the Rule of 70 offers a quick way to estimate how long it takes for a population to double. This rule states that doubling time (in years) is approximately equal to dividing the number 70 by the annual percentage growth rate.
Example: Practicing the Rule of 70
Suppose a small city’s population grows by 2% each year. Using the Rule of 70:
- Identify the growth rate (2%).
- Set up the formula: \text{Doubling Time} = \frac{70}{2}.
- Calculate \frac{70}{2} = 35.
Therefore, the population would double in about 35 years if it keeps growing at 2%.
Conclusion
Human population dynamics combines multiple factors—birth rates, death rates, infant mortality, and the Earth’s carrying capacity—to reveal how quickly (or slowly) populations grow or shrink. Although growth can bring economic development, it may also strain resources such as water and food. Malthusian theory underscores the risk of exceeding resource limits, while both density-independent and density-dependent factors can slow or halt population expansion.
Ultimately, examining population trends is vital for environmental scientists, policymakers, and communities. It informs land use planning, healthcare strategies, and sustainable resource consumption policies. By applying the Rule of 70 or analyzing infant mortality rates, decision‑makers can forecast future needs and risks. Consequently, studying population dynamics helps ensure that current and future generations maintain a proper balance between human demands and ecosystem health.
Key Vocabulary
- Birth Rate: The number of live births per 1,000 people in a year.
- Death Rate: The number of deaths per 1,000 people in a year.
- Infant Mortality Rate: The number of infant deaths (under one year old) per 1,000 live births.
- Carrying Capacity: The maximum number of individuals an environment can support without permanent ecological damage.
- Malthusian Theory: The idea that populations tend to grow faster than resources, leading to potential shortages.
- Density-Independent Factors: Environmental factors (e.g., natural disasters) that affect populations regardless of density.
- Density-Dependent Factors: Factors whose effects become stronger as population density increases (e.g., disease).
Sharpen Your Skills for AP® Environmental Science
Are you preparing for the AP® Environmental Science test? We’ve got you covered! Try our review articles designed to help you confidently tackle real-world AP® Environmental Science problems. You’ll find everything you need to succeed, from quick tips to detailed strategies. Start exploring now!
- AP® Environmental Science: 3.4 Review
- AP® Environmental Science: 3.5 Review
- AP® Environmental Science: 3.6 Review
- AP® Environmental Science: 3.7 Review
Need help preparing for your AP® Environmental Science exam?
Albert has hundreds of AP® Environmental Science practice questions, free response, and full-length practice tests to try out.


