What We Review
Introduction
Delving into the world of precalculus, implicitly defined function emerge as a fascinating topic to explore. Understanding these functions is crucial, especially in AP® Precalculus, as they lay the groundwork for more advanced mathematical concepts. Unlike explicitly defined functions, which are straightforward and predictable, implicitly defined functions hold a layer of complexity that challenges the usual method of finding relationships between variables. Therefore, grasping the basics of these functions and how they graphically represent data is essential for any high school precalculus student.
What is an Implicitly Defined Function?
An implicitly defined function is a function expressed through an equation involving two variables, without one being explicitly solved in terms of the other. In contrast, explicitly defined functions like y = f(x) provide a direct relationship where y is given in terms of x .
Example:
Consider the equation x^2 + y^2 = 25 . This equation characterizes a circle with a radius of 5. Unlike explicit functions, this equation does not isolate y in terms of x or x in terms of y . Instead, it defines a relationship between x and y that they jointly satisfy.
Graphing Implicitly Defined Functions
Graphing implicitly defined functions involves finding solutions to the equations by exploring various pairs of (x, y) that satisfy the given relationship. This process can identify symmetry and key features of the graph.
Example:
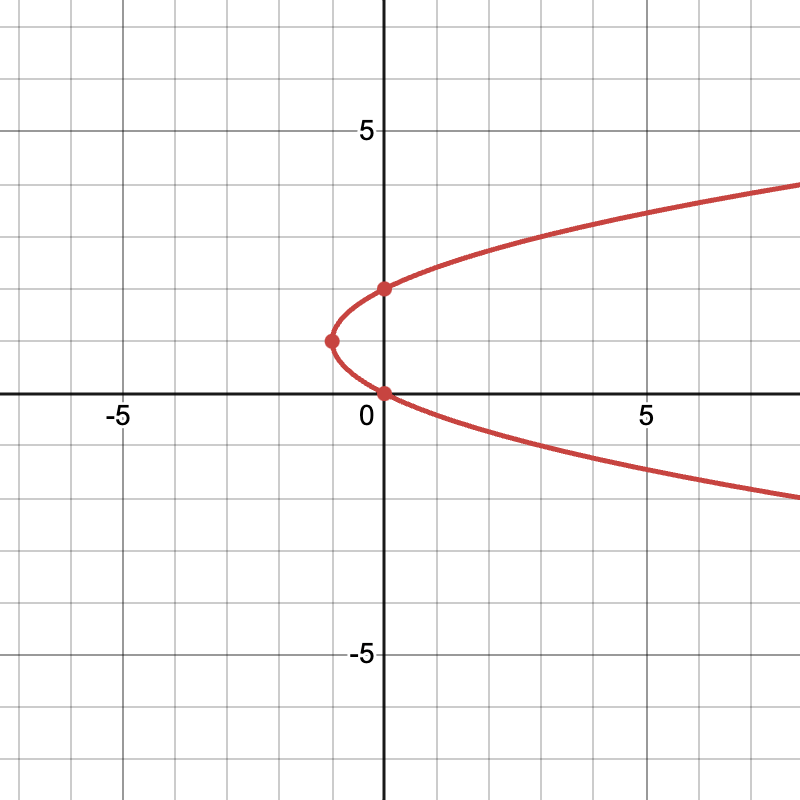
Graph the equation y^2 = x + 2y .
Step 1: Rearrange the Equation
Start by rearranging the equation if possible. For example, isolate terms: y^2 - 2y = x .
Step 2: Identify Key Points and Symmetry
Look for symmetry and easy points. Check x = 0 : y^2 = 2y \Rightarrow y(y-2) = 0 , so y = 0 or y = 2 . Key points are (0, 0) and (0, 2) .
Step 3: Sketch the Graph
Evaluate additional points, such as x =-1 , to see how y behaves. We can set x=-1 and solve for y again to find y=1 . Therefore, another point is (-1,1) Connect these with a smooth curve acknowledging any symmetry or specific features.
Understanding the Relationship Between Variables
Relationship Between Variables in an Implicit Function
Consider the equation of an ellipse: \frac{x^2}{9} + \frac{y^2}{4} = 1
This represents an ellipse centered at (0,0) with a horizontal axis of length 6 and a vertical axis of length 4.
To analyze how x and y change together, we look at nearby points:
- Point (0,2) → Moving slightly right to (1, ~1.89)
- Since increasing x makes y slightly decrease, the two variables change in opposite directions.
- Point (-3,0) → Moving slightly right to (-2, ~1.5)
- Here, y also increases, meaning the two variables change in the same direction.
This confirms that the ratio of change is negative when they move in opposite directions and positive when they move together.
Rate of Change
For the graph of x^2 + y^2 - xy = 4 on the x -interval (0,2) , what is the rate of change of y with respect to x ?
To find the rate of change of y with respect to x , we solve for two points on the curve.
Step 1: Find Two Points on the Graph
Let’s determine y for two values of x in the given interval.
- When x = 0 : 0^2 + y^2 - (0)(y) = 4
y^2 = 4
Solutions: y = 2 or y = -2 . - When x = 2 : 2^2 + y^2 - (2)(y) = 4
4 + y^2 - 2y = 4
y^2 - 2y = 0
y(y - 2) = 0 Solutions: y = 0 or y = 2 .
Step 3: Calculate the Rate of Change
Now, we have two points:
- At x = 0 , y = 2 or y = -2 .
- At x = 2 , y = 0 or y = 2 .
Step 4: Compute the Slope
Using the slope formula:
\frac{\Delta y}{\Delta x} = \frac{y_2 - y_1}{x_2 - x_1}
For (0,2) and (2,0) :
\frac{0 - 2}{2 - 0} = \frac{-2}{2} = -1 .
For (0,-2) and (2,2) :
\frac{2 +2}{2 -0} = \frac{4}{2} = 2 .
Final Answer
The rate of change of y with respect to x depends on the branch of the curve.
Quick Reference Chart: Vocabulary and Definitions
| Term | Definition |
| Implicitly Defined Function | A function defined by an equation involving two variables, where one variable is not explicitly solved for. |
| Rate of Change | The relationship between the changes in two variables; can be positive, negative, or zero. |
| Graph | A visual representation of the relationship between two variables, determined by the solutions to the equation. |
| Solution | An ordered pair (x, y) that satisfies an equation involving two variables. |
| Vertical/Horizontal Intervals | Sections of a graph where the rate of change is zero, indicating that one variable does not change as the other varies. |
Conclusion
Implicitly defined functions and their graphs present intriguing challenges in understanding real-world relationships between variables. Recognizing their importance in precalculus equips students with analytical tools essential for success in AP® Precalculus. With consistent practice and exploration, these concepts become less daunting and more intuitive. Students are encouraged to engage with various examples and problems to deepen understanding and proficiency.
Sharpen Your Skills for AP® Precalculus
Are you preparing for the AP® Precalculus exam? We’ve got you covered! Try our review articles designed to help you confidently tackle real-world math problems. You’ll find everything you need to succeed, from quick tips to detailed strategies. Start exploring now!
- 4.3 Parametric Functions and Rates of Change
- 4.4 Parametrically Defined Circles and Lines
- 4.6 Conic Sections
Need help preparing for your AP® Precalculus exam?
Albert has hundreds of AP® Precalculus practice questions, free responses, and an AP® Precalculus practice test to try out.


