

What We Review
Introduction
Nonlinear functions (especially quadratics and exponentials) sit at the heart of SAT® Math. They pop up in word problems, data tables, and tricky graphs. Therefore, understanding nonlinear functions boosts scores quickly. This guide breaks the challenge into three pillars: interpret, connect, and create & use. By the end, students can confidently create and use quadratic or exponential functions to solve problems in many contexts.
Interpreting Nonlinear Functions
1. Key Ideas of Nonlinear Functions
- A function is nonlinear when its graph is not a straight line.
- Common forms students must spot:
- Quadratic (parabola):
- Standard Form y = ax^{2} + bx + c
- Vertex Form y = a(x - h)^{2} + k
- Factored Form y = a(x - r_1)(x - r_2)
- Exponential (curve that rises or falls rapidly):
- Growth y = a\cdot(1 + r)^{t}
- Decay y = a\cdot(1 - r)^{t}
- Quadratic (parabola):
2. Nonlinear Functions: Quadratic Interpretation
Because quadratics model projectile motion and profit curves, the SAT® loves them.
- In y = ax^{2} + bx + c:
- a controls the opening (up/down) and width.
- b affects the axis of symmetry.
- c is the y-intercept.
- Vertex form, y = a(x - h)^{2} + k, highlights the vertex (h,k) and is the peak or valley of the parabola.
3. Nonlinear Functions: Exponential Interpretation
In y = a\cdot(1 + r)^{t} or y = a\cdot(1 - r)^{t}:
- a = initial value.
- r = growth (positive) or decay (negative) rate.
- Doubling time ≈ \dfrac{\ln 2}{\ln(1+r)}; halving time ≈ \dfrac{\ln 2}{|\ln(1-r)|}.
4. Example: Interpreting a Quadratic Word Problem
A ball is launched so that its height (in meters) after t seconds is h(t) = -5t^{2} + 20t + 2.
Find the maximum height and when it occurs.
To find the maximum height and when it occurs, follow these steps:
First, identify the coefficients of the quadratic function: a = -5, b = 20, and c = 2.
Since the function is quadratic and opens downward (because a < 0), the maximum height occurs at the vertex. The time at which the vertex occurs is given by the formula t_v = -\dfrac{b}{2a} = -\dfrac{20}{2(-5)} = 2 seconds.
To find the height at that time, substitute t = 2 into the original function:
h(2) = -5(2)^2 + 20(2) + 2 = -20 + 40 + 2 = 22 meters.The ball reaches a maximum height of 22 meters at 2 seconds.
5. Example: Interpreting an Exponential Growth Context
A bacteria culture starts with 150 cells and grows by 8\% each hour.
How many cells will there be after 5 hours?
Start by writing an exponential growth model:
N(t) = 150(1 + 0.08)^t = 150(1.08)^tNow substitute t = 5:
N(5) = 150(1.08)^5 \approx 150 \times 1.469 = 220.4After 5 hours, there will be approximately 220 cells (rounding to the nearest whole number).
Representations of Nonlinear Functions: Tables, Graphs, and Equations
1. Why Multiple Views Matter on the SAT®
SAT® items often show a table or partial graph and ask for an equation, or vice versa. Quickly switching representations saves time and reduces careless errors.
2. Algebraic ⇆ Graphical Links
- Zeros of f(x) ↔ x-intercepts of the graph.
- Vertex ↔ maximum or minimum point.
- f(0) ↔ y-intercept.
3. Algebraic ⇆ Tabular Links
- Constant second difference signals a quadratic.
- Constant ratio signals exponential growth/decay.
4. Graphical ⇆ Tabular Links
- Symmetry around the axis helps predict missing quadratic values.
- Curves that get steeper (or flatter) rapidly hint at exponential behavior.
5. Example: Matching a Factored Quadratic to Its Graph
Equation: y = 2(x + 1)(x - 5).
Describe the graph of the parabola.
To describe the graph of this parabola, start by identifying its zeros. Setting each factor equal to zero gives x = -1 and x = 5, so the graph crosses the x-axis at those points.
Next, look at the leading coefficient: a = 2. Since it is positive, the parabola opens upward, and because 2 > 1, the graph is narrower than the basic parabola y = x^2.
The axis of symmetry is halfway between the two zeros:
x = \dfrac{-1 + 5}{2} = 2.To find the vertex, substitute x = 2 into the equation:
y = 2(2 + 1)(2 - 5) = 2 \cdot 3 \cdot (-3) = -18.The graph is a narrow, upward-opening parabola that crosses the x-axis at -1 and 5, with a vertex at (2, -18).
6. Example: Creating a Table from an Exponential Equation
Given P(t) = 600 \times 0.5^{t}, list P(t) for t = 0,1,2,3. Then, spot the halving time.
Step-by-Step Solution
| t (hours) | P(t) |
| 0 | 600 |
| 1 | 600(0.5) = 300 |
| 2 | 600(0.5)^{2} = 150 |
| 3 | 600(0.5)^{3} = 75 |
Because the quantity is multiplied by 0.5 every hour, it halves each hour. Therefore, the halving time is 1 hour.
Creating and Using Nonlinear Functions to Model Real-World Problems
1. Choosing Between Quadratic or Exponential Models
- If data shows a constant second difference, select a quadratic.
- If data shows a constant ratio, choose an exponential.
2. Selecting the Best Form for Nonlinear Functions
Quadratic:
- Standard form reveals the y-intercept quickly.
- Factored form shows zeros immediately.
- Vertex form highlights the extreme value.
Exponential:
- a\cdot b^{x} is compact for quick calculations.
- a(1\pm r)^{t} emphasizes growth or decay rate.
3. Transformations and Their Graphical Impact
- Add k → vertical shift.
- Multiply by c → vertical stretch/compression.
- Multiply x by –1 inside → reflection across the y-axis.
- Multiply the whole function by –1 → reflection across the x-axis.
4. Example: Crafting a Quadratic for Projectile Motion
A football is kicked from ground level with an initial upward velocity of 28 m/s. Height after t seconds follows h(t) = -4.9t^{2} + 28t.
(a) Rewrite in vertex form.
(b) Find maximum height.
Step-by-Step Solution
a. Complete the square.
| Step | Reason |
|---|---|
| h(t) = -4.9t^2 + 28t | Original expression |
| h(t) = -4.9\left(t^2 - \dfrac{28}{4.9}t\right) | Factor out -4.9 from the first two terms |
| \dfrac{28}{4.9} = 5.714 | Simplify the coefficient |
| \left(\dfrac{5.714}{2}\right)^2 = (2.857)^2 = 8.16 | Half the coefficient and square it |
| h(t) = -4.9\left(t^2 - 5.714t + 8.16 - 8.16\right) | Add and subtract the square inside parentheses |
| h(t) = -4.9\left((t - 2.857)^2 - 8.16\right) | Complete the square by grouping terms |
| h(t) = -4.9(t - 2.857)^2 + 40 | Distribute -4.9 to both terms |
b. The vertex is (2.857,40). Therefore, the maximum height of approximately 40 m is reached after about 2.86 s.
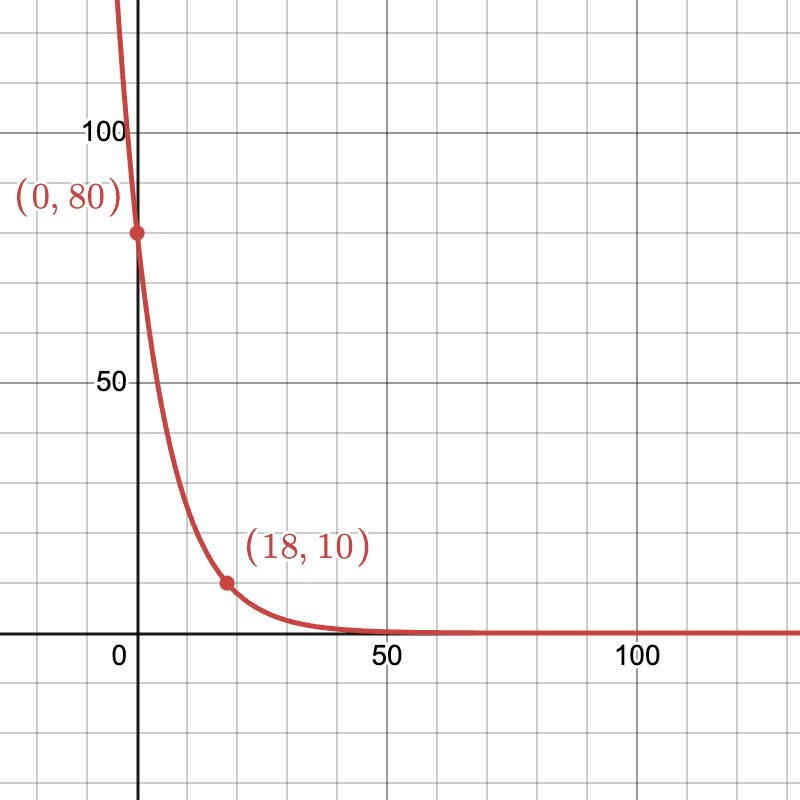
5. Example: Building an Exponential Decay Model for Half-Life
A radioactive isotope has a half-life of 6 hours. If 80 g are present now, how much remains after 18 hours?
Step-by-Step Solution
- Model: M(t) = 80 \times 0.5^{t/6}, where t is in hours.
- Substitute t = 18:
- M(18) = 80 \times 0.5^{18/6} = 80 \times 0.5^{3} = 80 \times 0.125 = 10 g.
- Therefore, 10 g remain after 18 hours.
Quick Reference Chart: Nonlinear Functions Vocabulary
| Term | Definition | Why It Matters on the SAT® |
| Vertex | The highest or lowest point of a parabola | Needed for max/min problems |
| Axis of symmetry | Vertical line through the vertex | Helps locate matching x-values |
| Zeros | Values where f(x)=0 | Give x-intercepts for factored quadratics |
| Growth factor | Multiplier b>1 in y=a\cdot b^{x} | Predicts a rapid increase |
| Decay factor | Multiplier 0<b<1 | Predicts a rapid decrease |
| Initial value | Starting amount a | Often equals f(0) |
| Doubling time | Time needed for quantity to double | Quick check for growth |
| Half-life | Time needed for quantity to halve | Common decay question |
| End-behavior | Trend as x\to\infty or -\infty | Distinguishes curves |
| Vertical shift | Added constant k | Moves the graph up or down |
Rapid-Fire Practice
Try these without a calculator first. Answers follow the methods above.
- A parabola has zeros at –3 and 4 and opens downward. Write its simplest factored form.
- Identify the y-intercept of g(x)=5(2^{x}) -4.
- A town’s population drops 12\% each year from 9{,}000 people. Create an equation for P(t).
- A quadratic has a vertex at (–2, 5) and passes through (0, –3). Determine a in vertex form.
- An exponential curve doubles every 1.5 days and starts at 40 units. Estimate its value after 6 days.
Solutions
- y = -1(x + 3)(x - 4)
- (0, 1)
- P(t) = 9000(0.88)^t
- a = -2
- 640
Final Tips & Takeaways
Interpret coefficients to read word problems quickly. Connect tables, graphs, and equations to switch viewpoints with ease. Create and use quadratic or exponential functions to solve problems by choosing the right form. Regular practice with timed sets cements these skills and raises SAT® Math scores. For deeper mastery, explore additional practice quizzes and revisit tricky examples.
Sharpen Your Skills for SAT® Math (Digital)
Are you preparing for the SAT® Math (Digital) test? We’ve got you covered! Try our review articles designed to help you confidently tackle real-world SAT® Math (Digital) problems. You’ll find everything you need to succeed, from quick tips to detailed strategies. Start exploring now!
Need help preparing for your SAT® Math (Digital) exam?
Albert has hundreds of SAT® Math (Digital) practice questions, free response, and full-length practice tests to try out.


