
What We Review
Introduction
A population’s survival patterns often reflect how it responds to changing environments and resource availability. In AP® Environmental Science, survivorship curves are crucial tools for exploring population dynamics. They are typically depicted as graphs that follow a cohort—individuals of the same age—through their entire lifespan. Species exhibiting different patterns of survival often align with broad life-history strategies, such as K-selected and r-selected species.
Therefore, examining survivorship curves can uncover important population trends and help scientists predict how environmental stressors impact these trends. When combined with other population growth models, or when assessed alongside global processes such as the carbon cycle and the shift to renewable energy, survivorship curves portray how ecological systems respond over time.
What Are Survivorship Curves?
A survivorship curve is a graphical representation of the proportion or number of individuals surviving at each age interval in a population. In mathematical terms, survivorship often begins at 100 % (when the cohort is first formed) and decreases gradually as individuals die.
In studies of population dynamics, this approach involves observing a cohort from birth until all members die. Scientists record the survival of each individual at regular intervals. Then, they often calculate the fraction of surviving individuals:
S(t) = \frac{n(t)}{n_0}where n(t) is the number of surviving individuals at time t, and n_0 is the initial number of individuals in the cohort.
Cohorts and Their Significance
A cohort refers to a group of organisms that are all born, hatched, or germinated during the same period. Cohort analysis allows scientists to look at age-specific mortality rates, which become the foundation for building survivorship curves. Furthermore, this method reveals how different environmental pressures affect the entire group at various life stages.
Types of Survivorship Curves
Over time, biologists have recognized three main types of survivorship curves. Each type reflects a distinct survival pattern, often shaped by the species’ reproductive traits, developmental strategies, and ecological pressures.
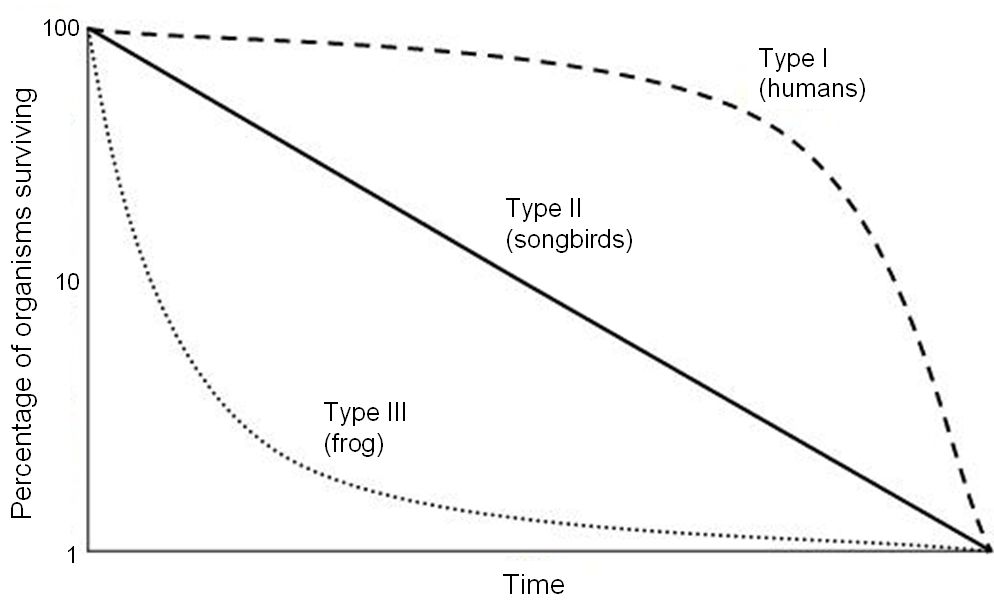
Type I Survivorship Curve
A Type I survivorship curve is typically characterized by relatively low mortality rates at younger ages, followed by a higher mortality rate among older age groups. Organisms that fit this description often have:
- High levels of parental care
- Low birth rates but significant investment in offspring survival
- Larger body sizes
Examples include humans and other large mammals, such as elephants. Human populations generally have extensive care for infants and children, resulting in higher survival into adulthood. Later in life, mortality increases more sharply.
Type II Survivorship Curve
A Type II survivorship curve shows a roughly constant mortality rate throughout the lifespan. With this pattern, individuals face similar survival probabilities at all ages. Some species that exhibit Type II curves include certain bird species and reptiles such as snakes. The line representing survivorship tends to slope steadily downward, indicating that age does not significantly influence the likelihood of dying at any given point.
Type III Survivorship Curve
A Type III survivorship curve typically exhibits very high mortality rates at young ages, followed by a much lower mortality rate for survivors who reach older ages. Species that follow this pattern often:
- Produce large numbers of offspring
- Provide minimal parental care
- Rely on at least a few offspring surviving to adulthood
Examples include sea turtles and many fish species. Although large numbers of eggs may be laid, only a small minority of hatchlings survive past their earliest life stages. Once they reach adulthood, their mortality risk may decrease significantly.
K-Selected vs. R-Selected Species
When exploring survivorship curves, it is useful to connect them to the concepts of K-selected and r-selected species. These classifications—commonly linked to population growth strategies—inform how species allocate their resources.
K-Selected Species
K-selected species tend to have:
- Fewer offspring (low fecundity)
- High parental investment
- Longer lifespans
Because of their reproductive strategies, these organisms often display Type I or Type II survivorship curves. Large mammals, such as elephants and whales, emphasize survival of offspring rather than high reproductive output. They often take advantage of stable habitats where competition for limited resources shapes their life-history traits.
R-Selected Species
R-selected species usually:
- Produce many offspring at once
- Provide little or no parental care
- Have short lifespans
As a result, these species typically exhibit Type III survivorship curves. Examples include many fish and insect populations, in which massive numbers of eggs or offspring exist yet only a small fraction reach adulthood. Rapid reproduction allows these species to quickly occupy unstable or changing environments.
Applications of Survivorship Curves
Survivorship curves have extensive applications in both conservation biology and environmental management. They guide environmental scientists as they evaluate threats to populations and determine which ages or life stages are most vulnerable. For instance, if a conservation program identifies that most mortality in a marine turtle population occurs early in life, management efforts might focus on protecting hatchlings. Alternatively, if older age classes are at higher risk, policies may enhance the survival of adults through stricter protection of breeding habitats.
Furthermore, survivorship data can inform species-specific population growth models. Researchers often combine survivorship curves with fertility data to simulate how a population might change in response to environmental pressures, such as habitat loss or climate change. These insights link directly to broader ecological topics (e.g., the carbon cycle) by showing how populations adapt or decline in habitats undergoing shifts related to carbon emissions or transitions to renewable energy sources.
Example Calculation
Constructing a simple survivorship curve helps illustrate the mechanics behind these graphs. Consider a hypothetical population of 100 organisms at birth:
- At time t = 0, there are n_0 = 100 individuals.
- After 1 year, 80 individuals remain alive (n(1) = 80).
- After 2 years, 60 remain alive (n(2) = 60).
- After 3 years, 15 remain alive (n(3) = 15).
- After 4 years, 0 remain (all have died).
To calculate survivorship at each time interval, use the proportion of individuals surviving relative to n_0:
- At t = 0: S(0) = \frac{100}{100} = 1.0
- At t = 1: S(1) = \frac{80}{100} = 0.8
- At t = 2: S(2) = \frac{60}{100} = 0.6
- At t = 3: S(3) = \frac{15}{100} = 0.15
- At t = 4: S(4) = \frac{0}{100} = 0.0
Graphing S(t) on the vertical axis against time on the horizontal axis would create a visual representation of the population’s survival pattern. In this data set, most mortality occurs between years 2 and 3, indicating a possible transition from a moderate to a higher mortality stage.
Practice Questions
- A species of fish produces thousands of eggs each year, yet only a small number survive to adults. Which type of survivorship curve would this species likely display, and why?
- Describe how a Type I survivorship curve differs from a Type III curve in terms of reproductive strategies.
- From a conservation standpoint, why might understanding the primary mortality stage of an organism be critical for designing protection measures?
- A bird population displays consistent survival rates throughout its life. Which survivorship curve fits this pattern, and how might that shape conservation efforts?
Answering these questions can solidify comprehension of how survivorship curves function and their importance in AP® Environmental Science.
Key Vocabulary
- Survivorship Curve: A graph that illustrates the survival of individuals in a cohort from birth until the last individual dies.
- Cohort: A group of individuals of the same age within a population, followed through time.
- K-Selected Species: Species that typically produce fewer offspring and invest heavily in caring for them, often displaying Type I or Type II survivorship curves.
- R-Selected Species: Species that produce many offspring with minimal parental care and often exhibit Type III survivorship curves.
- Population Dynamics: The study of how and why populations change over time, focusing on factors like birth rates, death rates, and migration.
Conclusion
Survivorship curves offer a concise way to visualize the lifespan trends of a population. They reflect how different organisms have evolved life-history strategies that maximize survival under specific environmental conditions. K-selected species generally invest in prolonged care and exhibit Type I or II curves, whereas r-selected species often produce large numbers of offspring and display Type III curves. Identifying these patterns aids in shaping effective conservation strategies and environmental policies.
Survivorship information also drives scientific models that can predict population responses to pressures like climate change or habitat loss. These models integrate data from other areas of environmental science, linking survivorship with population growth models and broader processes like the carbon cycle. In AP® Environmental Science, survivorship curves emerge as vital tools for understanding and managing ecosystem dynamics.
Sharpen Your Skills for AP® Environmental Science
Are you preparing for the AP® Environmental Science test? We’ve got you covered! Try our review articles designed to help you confidently tackle real-world AP® Environmental Science problems. You’ll find everything you need to succeed, from quick tips to detailed strategies. Start exploring now!
- AP® Environmental Science: 2.6 Review
- AP® Environmental Science: 2.7 Review
- AP® Environmental Science: 3.1 Review
- AP® Environmental Science: 3.2 Review
Need help preparing for your AP® Environmental Science exam?
Albert has hundreds of AP® Environmental Science practice questions, free response, and full-length practice tests to try out.


